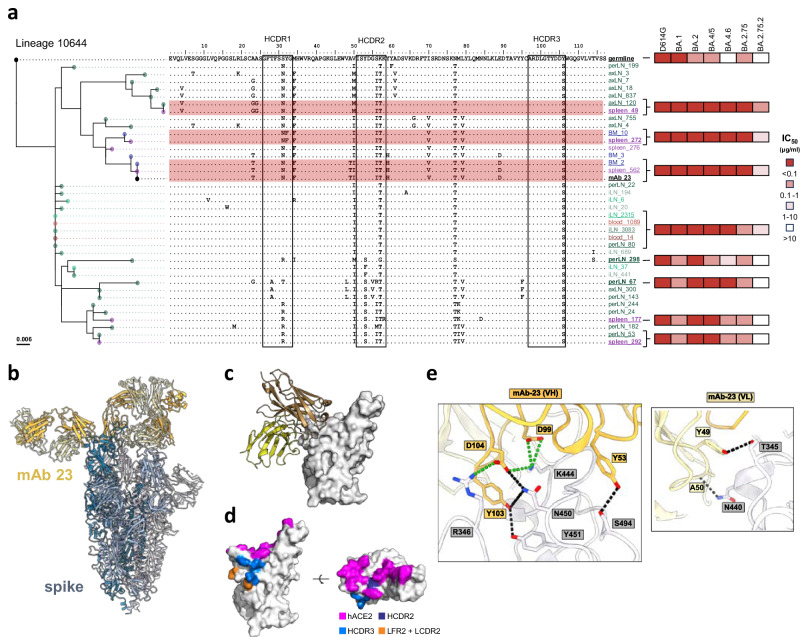
Fig. 5. Phylogenetic and cryo-EM analysis of mAb 23 in complex with spike.
a mAb 23 phylogenetic tree, with amino acid alignment of each member. The tree is rooted to its germline, each member is color coded in red, blue, green, and purple for blood, BM, LN and spleen, respectively, with darker shades for increasing weeks. Positions of SHM are indicated and the HCDRs are highlighted by black squares. IC50 neutralizing titers against D614G, BA.1, BA.2, BA.5, BA.4.6, BA.2.75, and BA.2.75.2 for expressed members of the lineage are shown to the right in a red color scale. Neutralization assays were performed in triplicates for each member. Source data are provided as a Source Data file. b Cryo-EM structure of the mAb 23 Fab interacting with the D614G prefusion spike. c Closer-up representation of mAb 23 interacting with the RBD. d Contact residues mapped on the RBD. hACE2 is colored purple, HCDR2 in dark blue, HCDR3 in light blue and LC in orange. e mAb 23 and RBD residues interaction. mAb23 is colored in yellow while the RBD residues are shown in white/gray. Ionic bonds are represented as dotted lines in green and hydrogen bonds in black.

