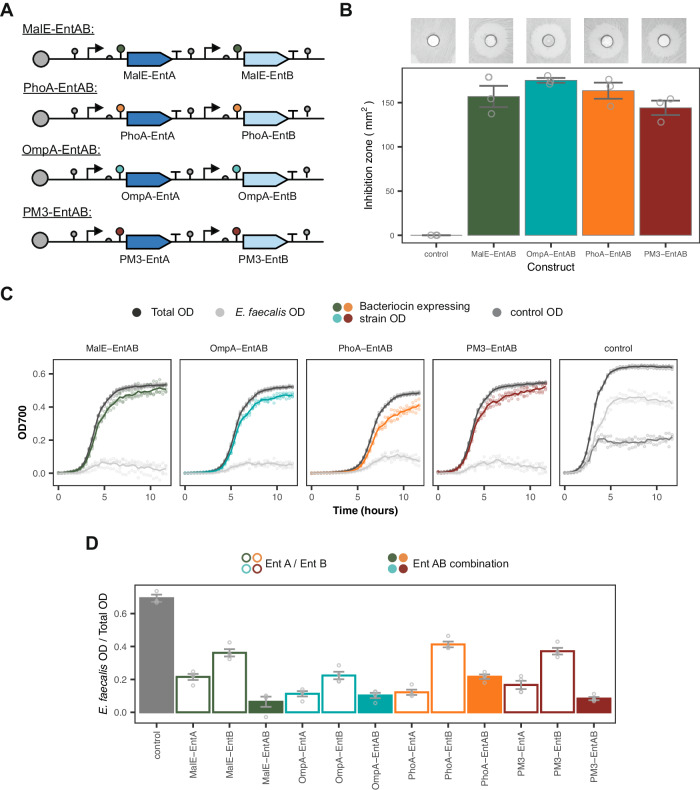
Fig. 4. Full characterisation of the dual-bacteriocin expressing strains.
A Plasmid layout of the co-expressing strains. B Inhibition zones of the dual-secreting strains. Insets show representative images of the inhibition zones. Bars indicate mean values ± SE (n = 3 biological repeats). C Growth curves of strains in co-culture. Labels give bacteriocin construct produced by competitor strain. Lines indicate mean and points show individual measurements (n = 4 biological repeats). D Estimated ratio of E. faecalis OD over total OD at 10 h for the dual-bacteriocin strains compared to the ratios given in Figure 3C, when grown in co-culture. Bars give mean values ± SE (n = 4 biological repeats). Source data are provided as a source data file.

