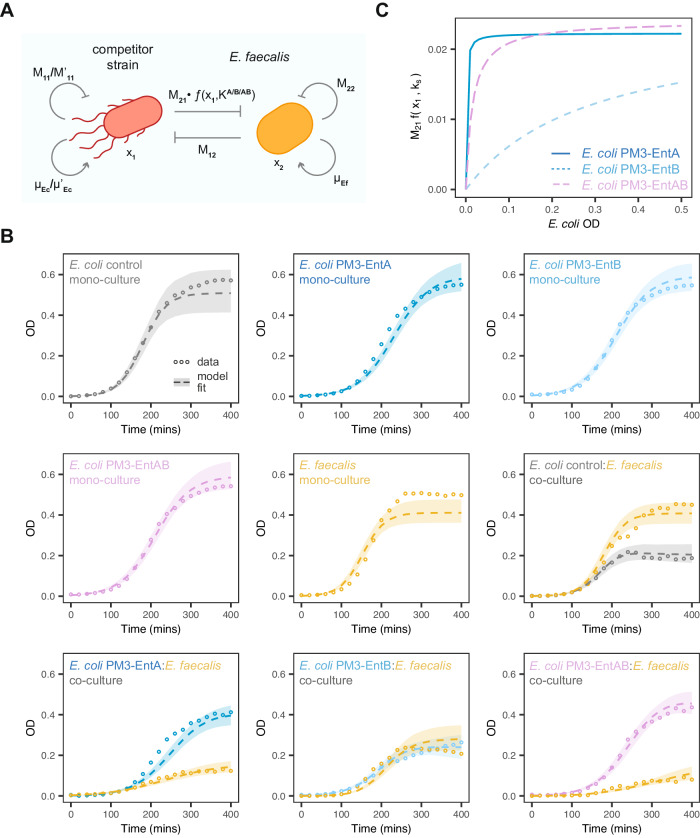
Fig. 6. Lotka–Volterra model fitting of co-culture growth dynamics.
A Schematic of the major model parameters, xi refers to species, μi to species growth rate and Mij to species interactions. B Fitted growth curves for the labelled mono- and co-cultures (circles give mean experimental value, dashed lines give the median simulated timecourse and shaded regions the 95% credible region). C The fitted interaction term (M21 ⋅ f(x1, ks)) against the estimated OD for the given strains, using the median of the posterior distribution. Source data are provided as a source data file.

