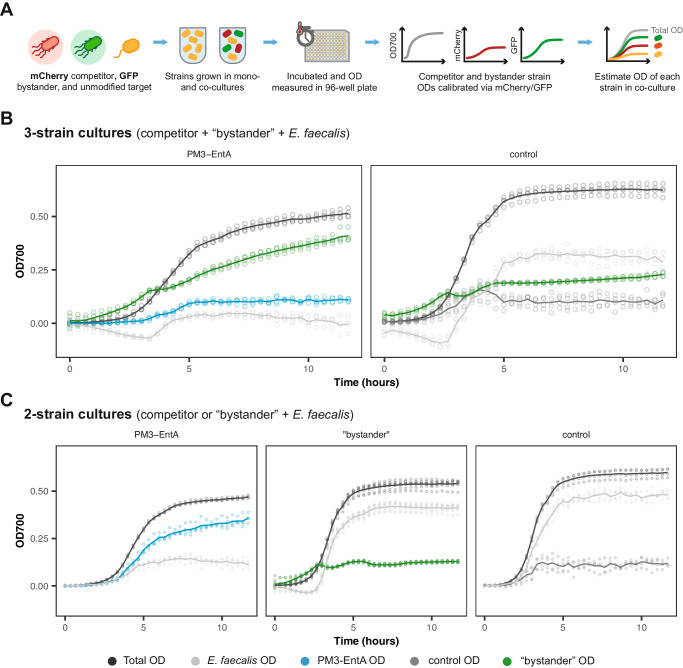
Fig. 7. Three-strain community culture dynamics.
A Overview of the experimental process for measuring growth in the three-strain communities. GFP and mCherry fluorescent signals are used to estimate the OD of the bystander and competitor strains, respectively. B Growth curves of the PM3-EntA competitor, bystander and E. faecalis (left panel) and the control competitor, bystander and E. faecalis (right panel) strains in co-culture. C Growth curves of the PM3-EntA, bystander or control strain in co-culture with the E. faecalis target strain in a two-strain co-culture. Lines indicate mean and points show individual measurements (n = 4 biological repeats). Source data are provided as a source data file.

