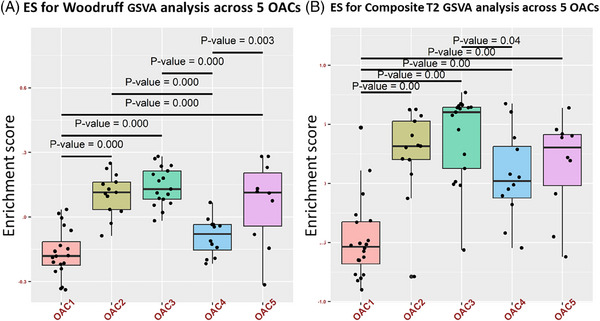
FIGURE 2.

Enrichment of type 2 (T2) inflammation in omics‐associated cluster (OAC)3. Gene set variation analysis (GSVA) boxplots showing the enrichment score (ES) for the Woodruff T2 signature (A) and a composite T2 cytokine and mediator panel (B) in sputum omics‐associated cluster (OAC)3 compared to other OACs.
