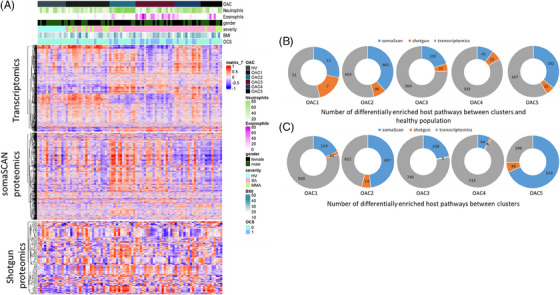
FIGURE 4.

Enrichment of genes, proteins and pathways across the sputum omics‐associated clusters. (A) Heatmap of 72 asthmatic subjects (columns) with 1472, 1362 and 781 pathways (rows) based on the gene set variation analysis (GSVA) of transcriptomic, somaScan and shotgun proteomics datasets, respectively. The sputum neutrophil and eosinophil percentages, sex, oral corticosteroids (OCS) use, body mass index (BMI), and asthma severity for each participant are mapped above the Heatmap. (B) Piechart of number of differentially enriched pathways between clusters and healthy population (q value < .05). The numbers on the segments are number of differentially enriched pathways between the 5 omics‐associated clusters (OACs) and healthy volunteers (HV). (C) Pie chart of the number of differentially enriched pathways between clusters (q value < .05). The numbers on the segments show differentially enriched pathways by one versus comparison (e.g. OAC1 vs. OAC2:5). Pie charts are coloured based on the datasets: SomaScan in blue, shotgun proteomics in orange and transcriptomics in grey. SA, severe asthma; MMA, mild and moderate asthma.
