
FIGURE 5.
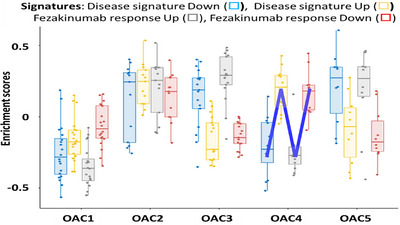
Gene set variation analysis (GSVA) of disease and anti‐IL‐22 (Fezakinumab, Fz) response signatures across 5 omics‐associated clusters (OACs)1‐5. Significantly down‐ and upregulated genes expressed in disease (Disease signature Down □ and Up □), and genes that are significantly up‐ and downregulated by Fz (Fz response Up □, FZ response Down □) are shown for OACs 1–5. A cluster that is likely to respond to Fz will have a low Disease Down and Fz Up signature enrichment and a high Disease Up and Fz Down signature. This results in an ‘N’‐shaped response (indicated in blue). This criterion is met by OAC4.