
FIGURE 6.
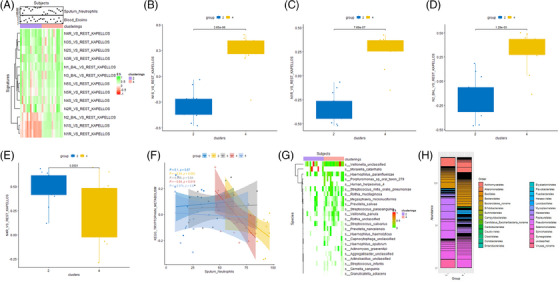
Differential enrichment of neutrophil subsets between neutrophil‐enriched omic‐associated clusters (OAC2) and OAC4. (A) Heatmap showing enrichment of neutrophil subtype gene signatures according to OAC2 and 4 and correlation with blood eosinophils and sputum neutrophil percentages. Boxplots showing enrichment scores (ES) for gene set variation analysis (GSVA) of neutrophil subtypes N1S (B), N1R (C), N2BAL (D) and (N4R (E) in the sputum of OAC2 and OAC4 patients. Adjusted p values are shown. (F) Inverse relationship between sputum neutrophil percentages and tryptophan metabolism in OAC4 (r = −.64, p = .019) but not in other OACs. (G, H) Heatmaps of microbial species showing the increased prevalence of Moraxella catarrhalis in OAC2 compared to OAC4 and a greater reduction of most other species in OAC4 compared to OAC2.