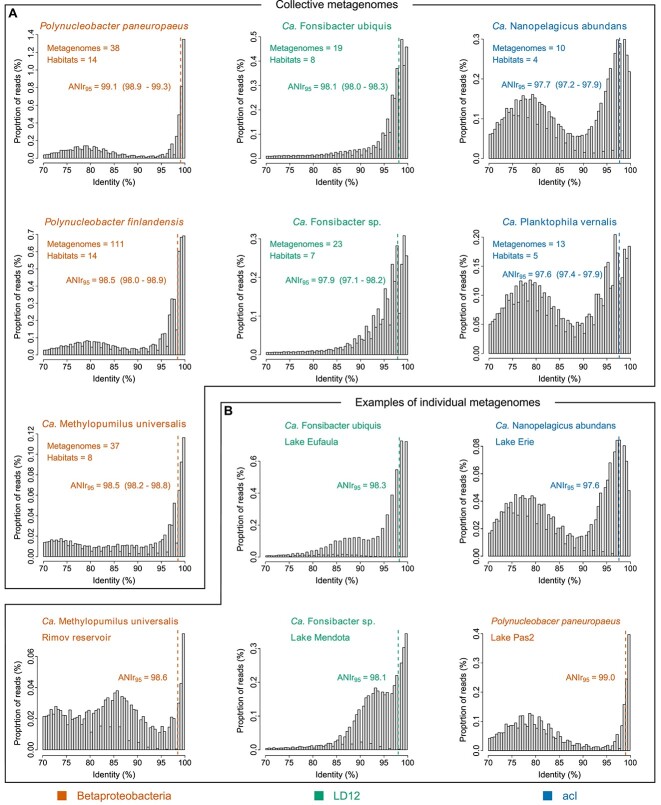
Figure 1.
Histograms of metagenome reads mapped to the reference genomes by BLAST: (A) Collective mappings of metagenomes from different locations. The numbers of metagenomes and habitats underlying each plot are given on the upper left. For each species the ANIr95 value across all respective metagenomes is given and indicated by a dashed line. The range of ANIr95 values when computed for the respective metagenomes separately is given in brackets. (B) Selected examples of individually mapped metagenomes. All histograms from individual metagenomes are shown in Supplementary Fig. S1.

