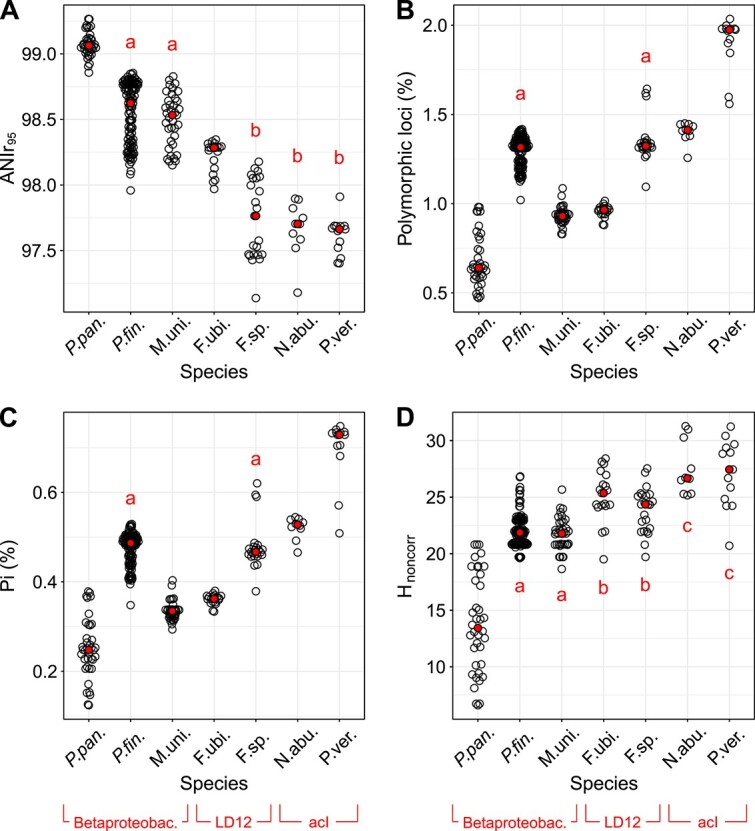
Figure 2.

Intra-population diversities for the seven species according to different metrics. Each dot refers to one metagenome. Median values are shown as filled red dots. Pairs that are not significantly different (P > .05) according to Wilcoxon-Mann–Whitney rank sum test are marked with a common letter.
