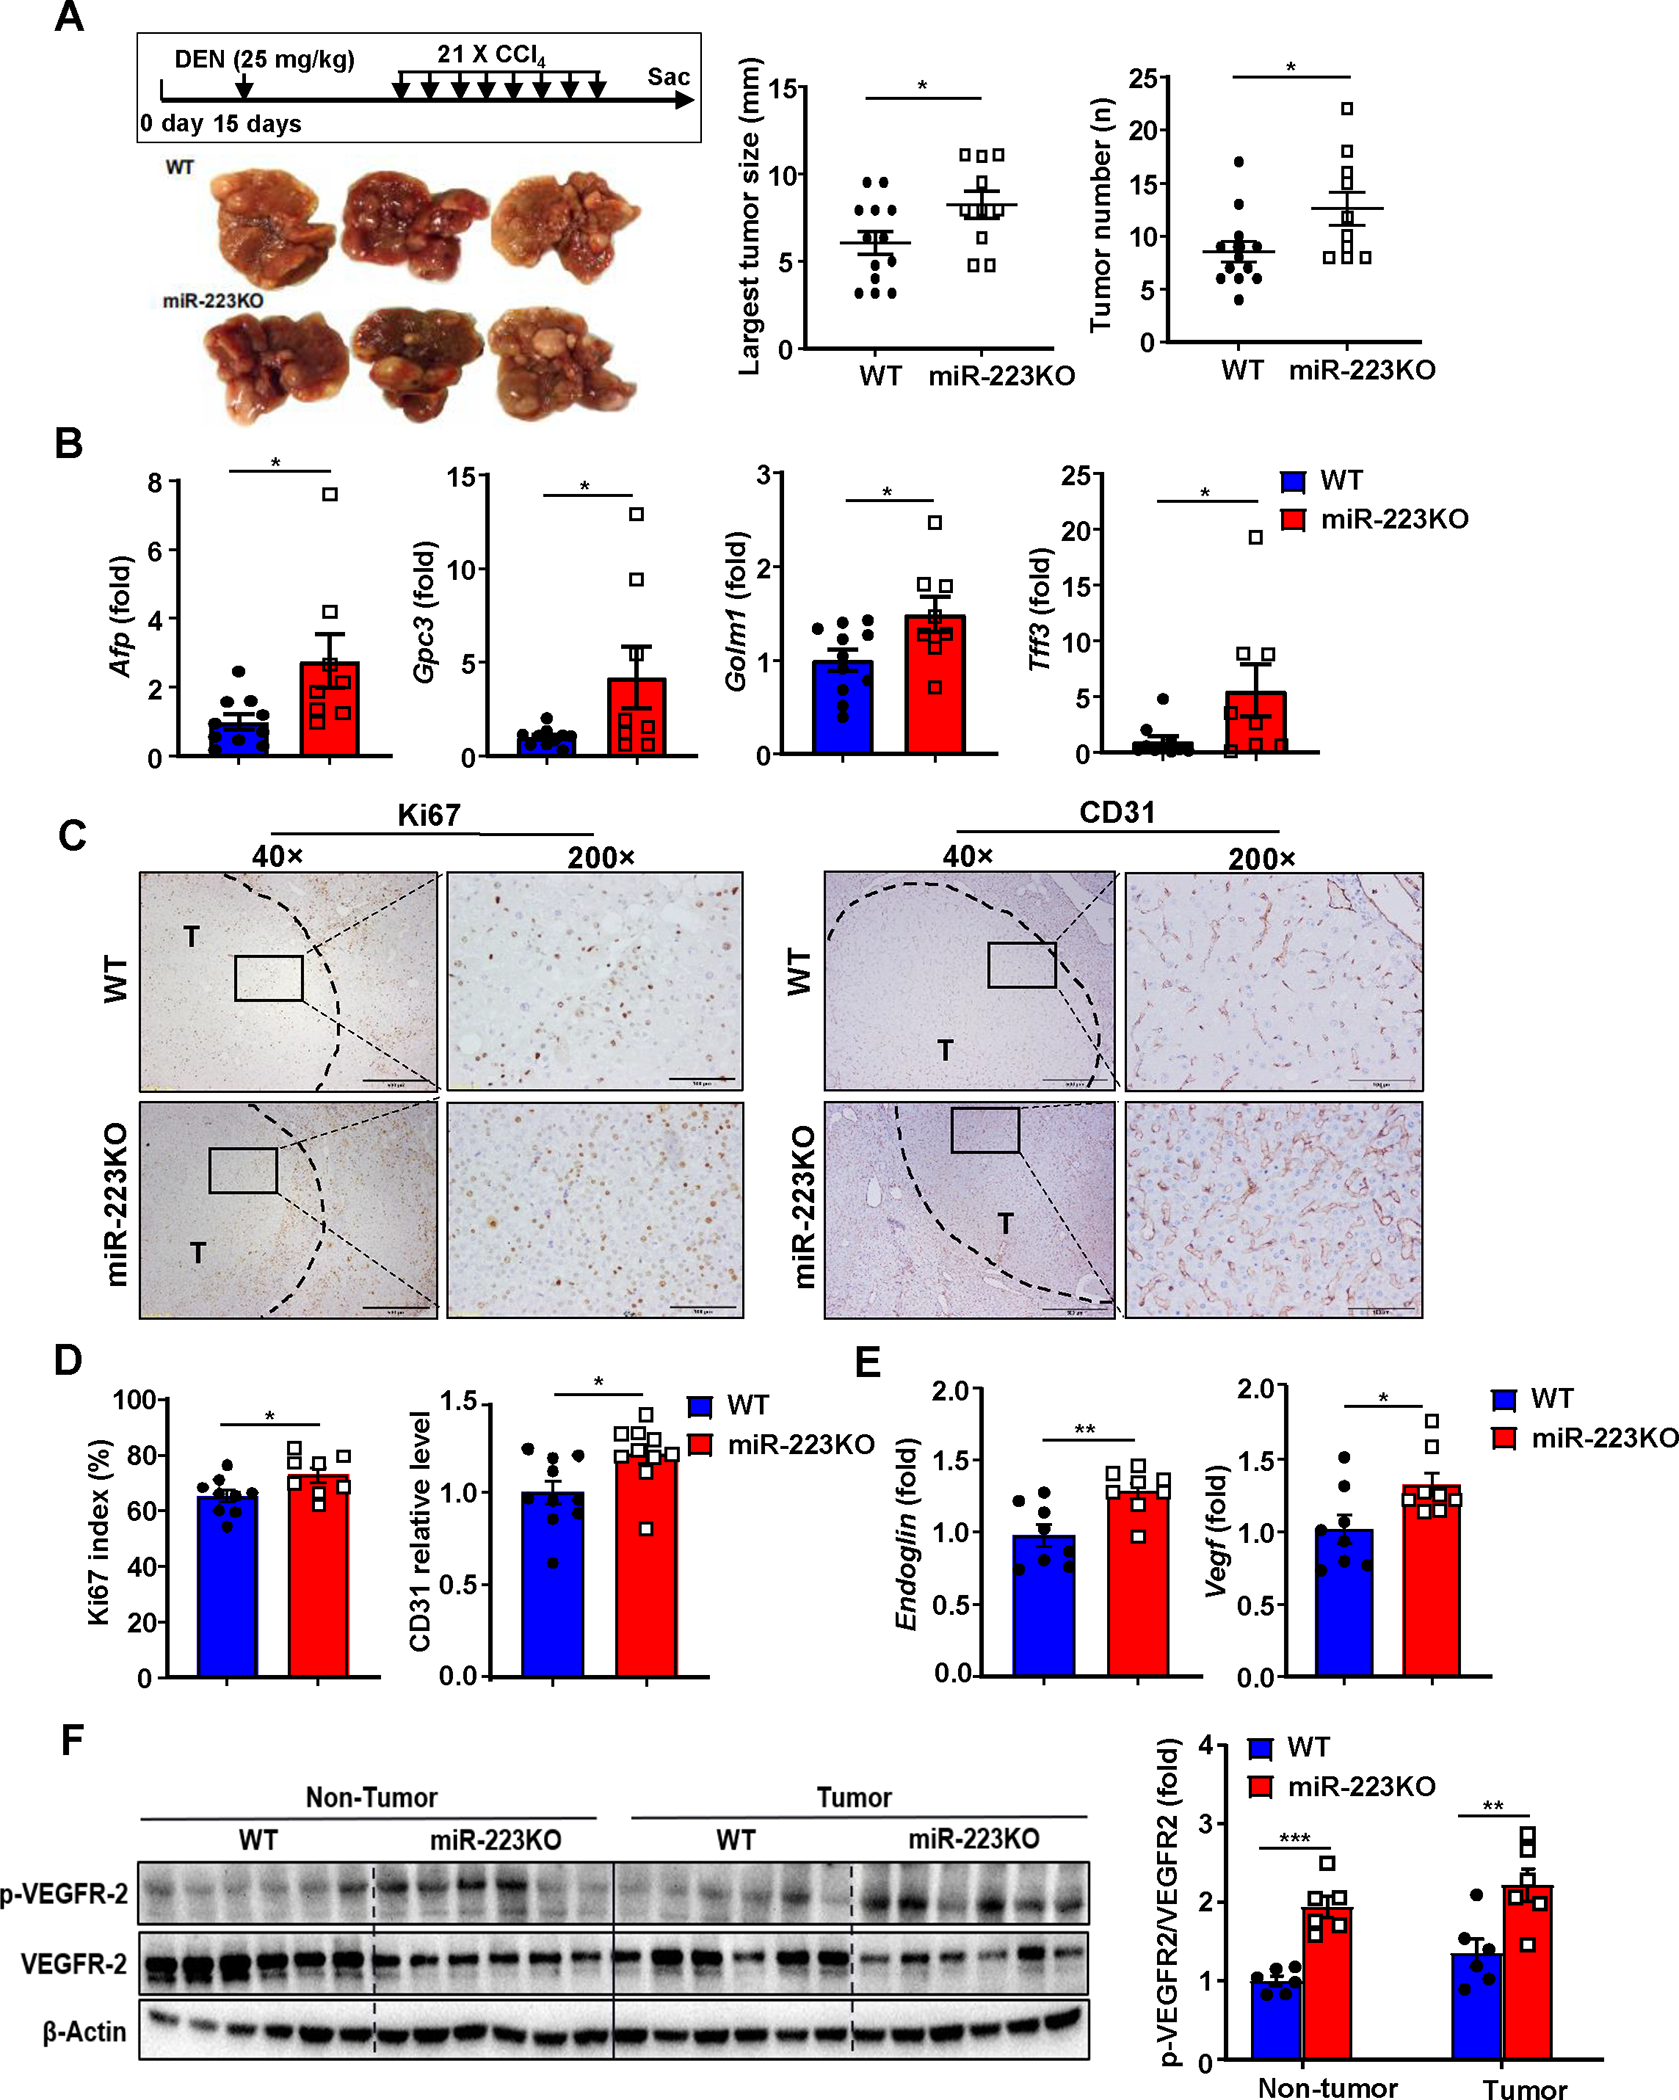
Figure 1. MiR-223 deficiency exacerbates HCC development and angiogenesis.

(A) Scheme of DEN+CCl4-induced HCC mouse model (see details in methods). Representative gross images of livers from miR-223KO and WT mice post DEN+CCl4 treatment are shown. The largest tumor diameter and the number of tumor masses were calculated (right panel). (B) RT-qPCR analyses of HCC markers including Afp, Gpc3, Golm2, and Tff3 in samples from miR-223KO and WT mice after DEN+CCl4. (C) Representative images of Ki-67 and CD31 staining in livers from miR-223KO and WT mice are shown. Tumor region was surrounded by dashed line (T: tumor region). (D) Ki-67 positive cells were counted and quantified as proliferation index; CD31 staining was quantified as the percentage of positive area in the whole section area. (E) RT-qPCR analyses of angiogenesis-related genes Endoglin and Vegf in HCC samples from miR-223KO and WT mice. (F) Western blot analysis of VEGFR2 and phosphorylated VEGFR-2 in non-tumor and tumor samples. Relative p-VEGFR2 protein levels were quantified. Values represent means ± SEM. *P< 0.05, **P< 0.01, ***P< 0.001.
