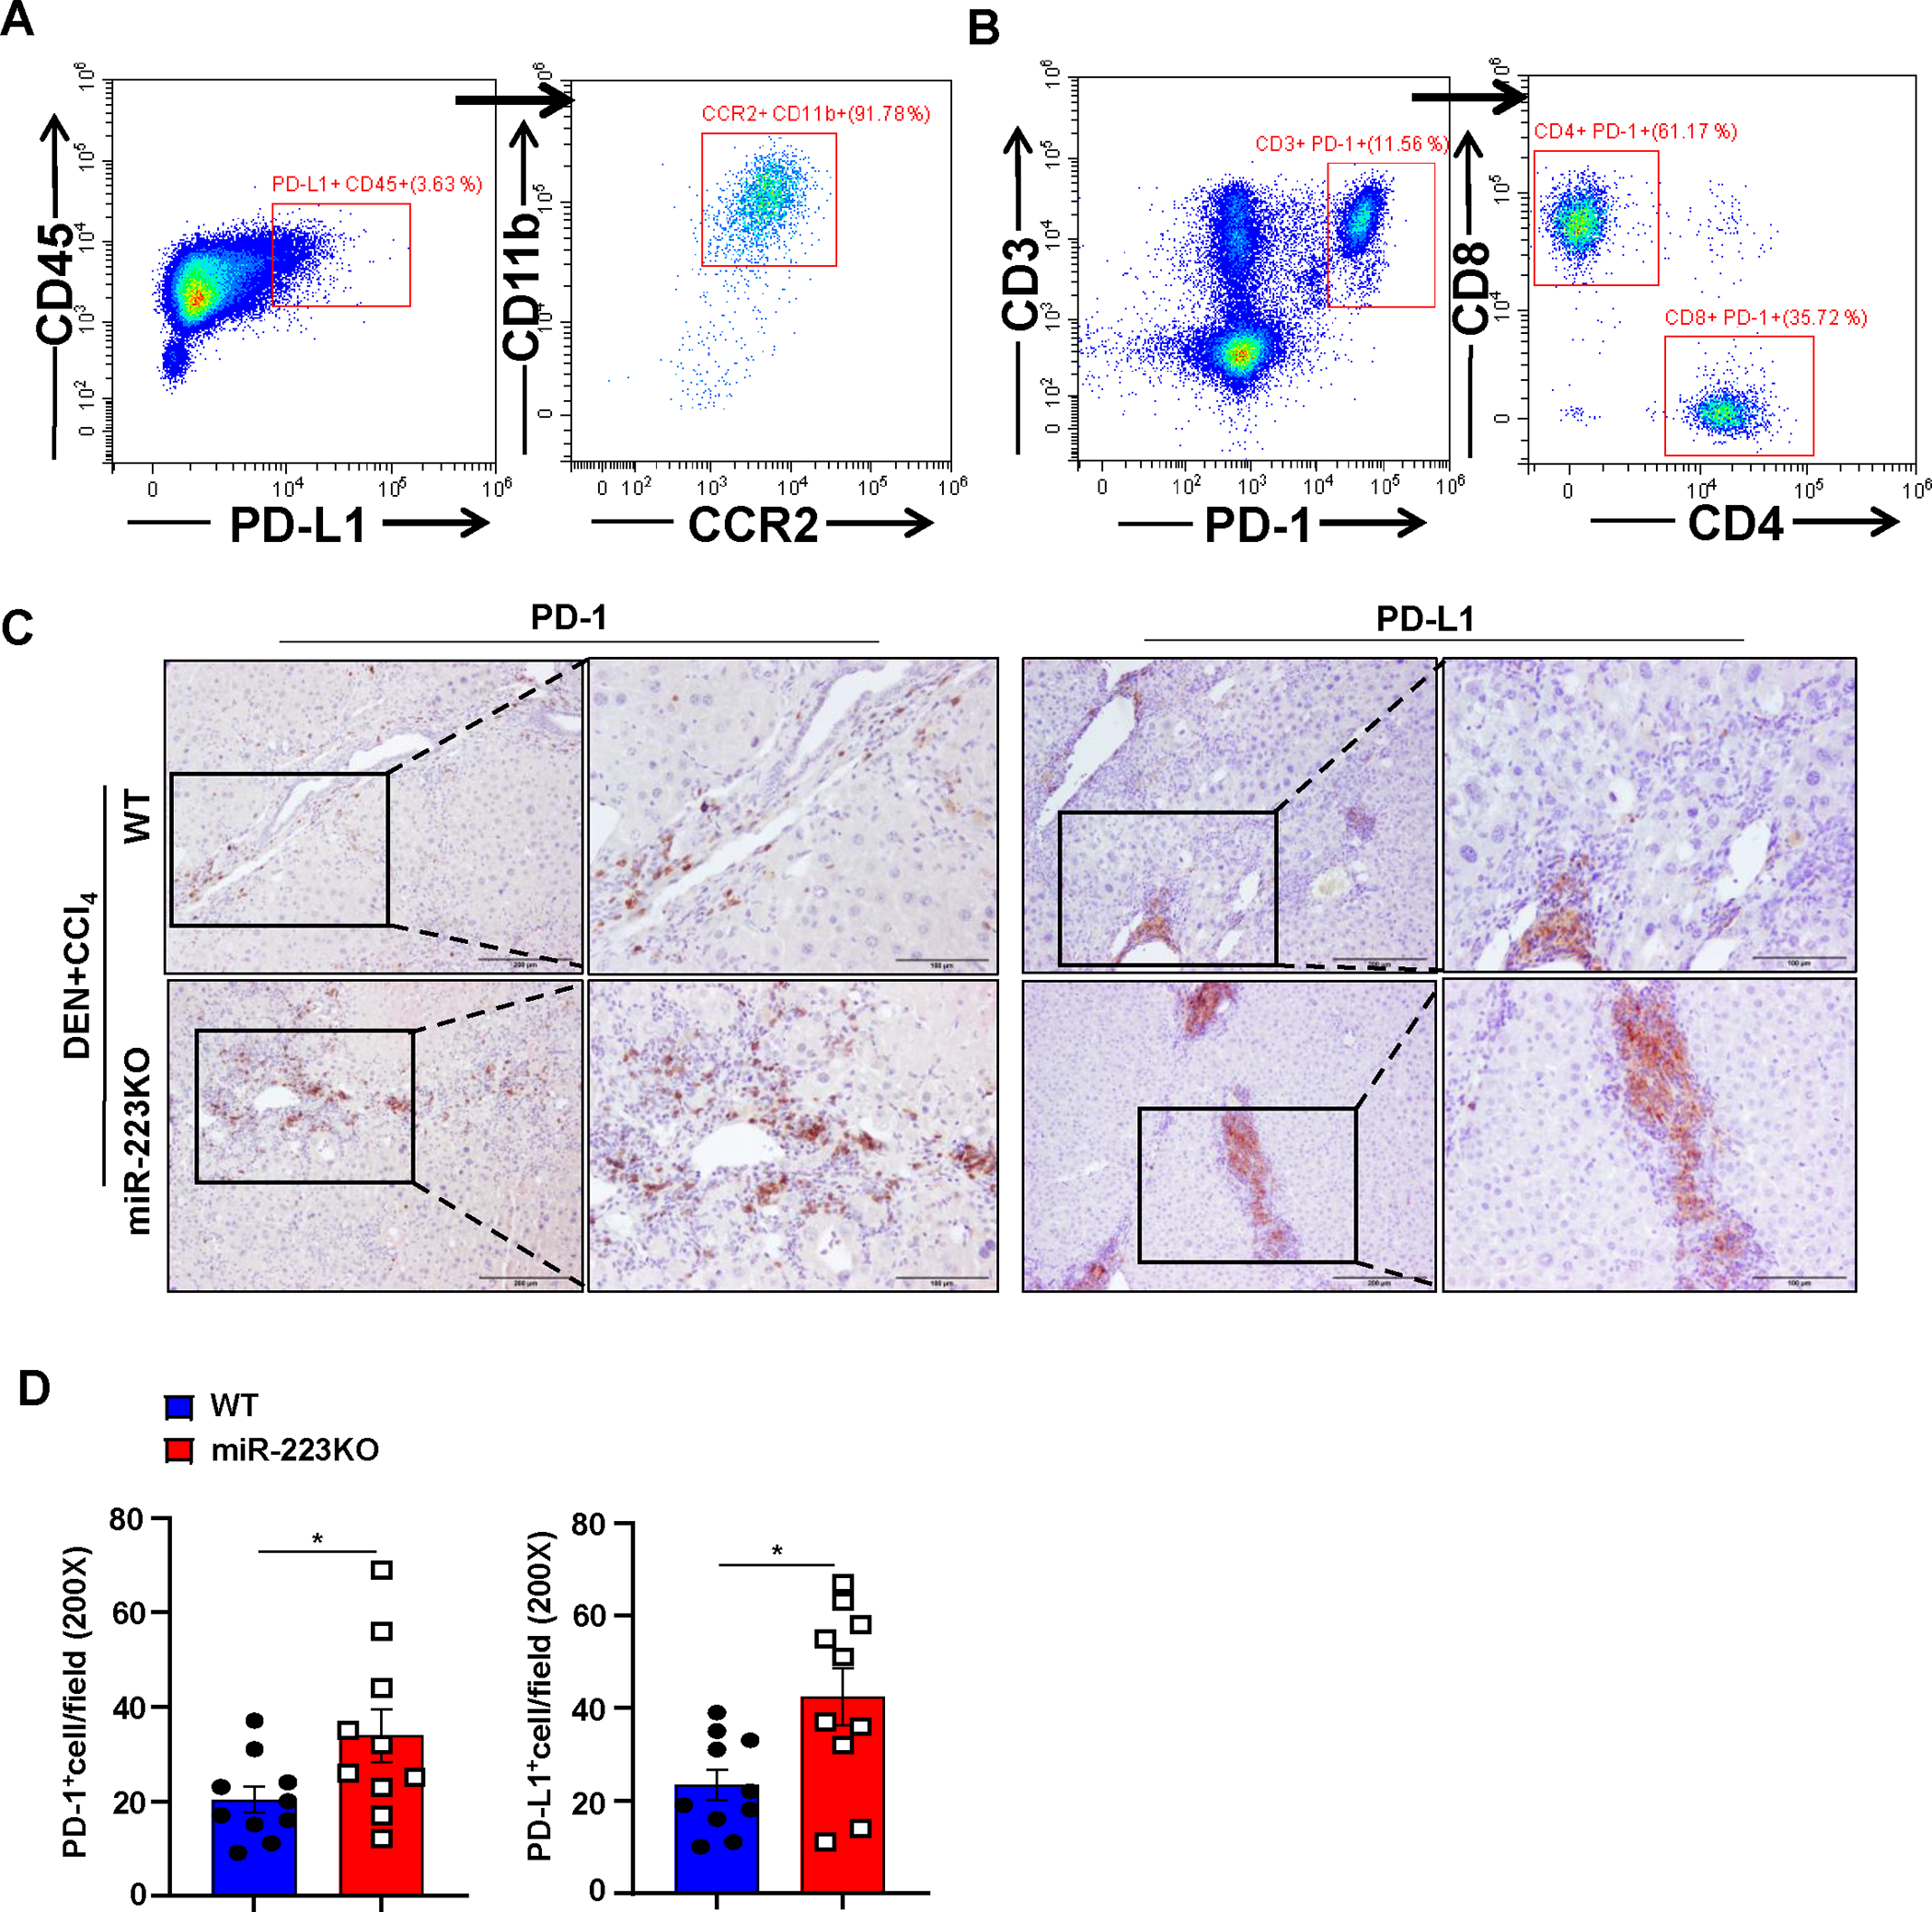
Figure 3. MiR-223KO mice have higher PD-1+T cells and PD-L1+macrophages than WT mice in DEN+CCl4-induced HCC.

WT and miR-223KO mice were treated with DEN+CCl4 as described in Figure 1. (A, B) Mouse livers from DEN+CCl4-induced HCC were dissociated, PD-1+ or PD-L1+ cells were determined by flow cytometry. PD-L1 and PD-1 expression were mainly detected in CD11b+ CCR2+ macrophages (panel A) and CD4+/CD8+ T cells (panel B), respectively. (C, D) Representative images of PD-1 and PD-L1 staining of tumor and adjacent non-tumor samples from DEN+CCl4 are shown in panel C. PD-1+ and PD-L1+ cells per field were quantified and are shown in panel D. Values represent means ± SEM. *P< 0.05.
