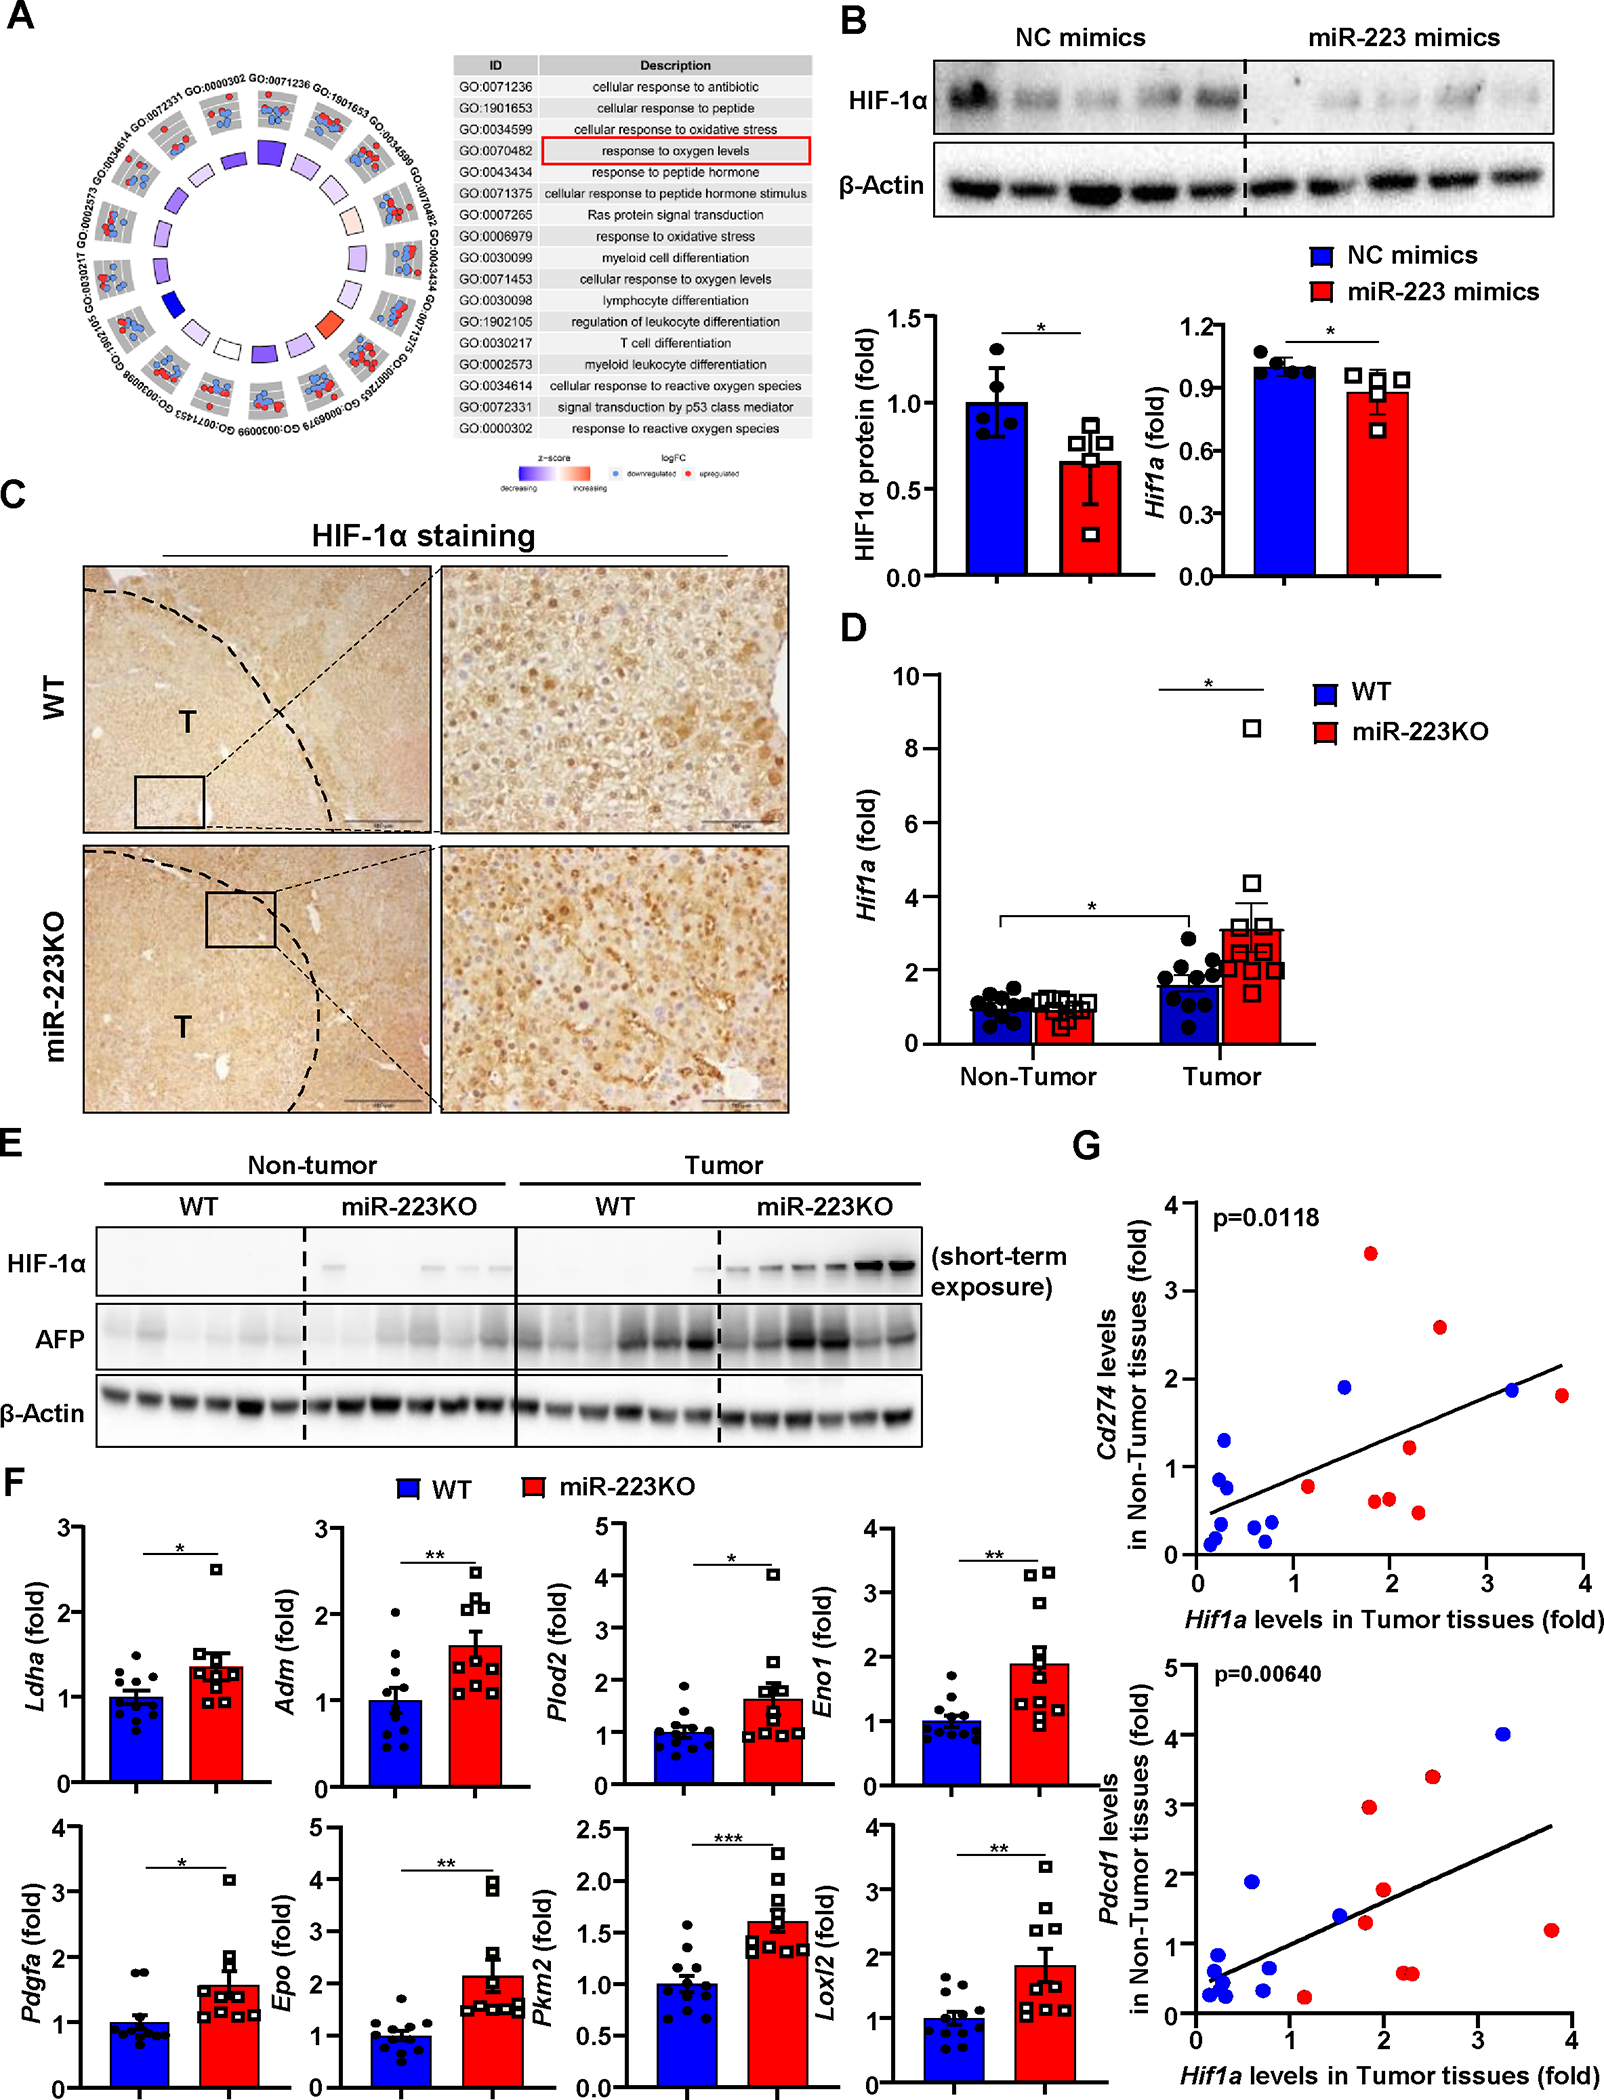
Figure 4. HIF-1α in HCC cells is a direct downstream target of miR-223.

(A) Gene Ontology (GO) analysis was performed to compare the difference of gene profiling between miR-223high and miR-223low HCC patients in TCGA database, and the results are shown on the right side. (B) Measurement of HIF-1α protein levels by western blot in Hepa1-6 cell after miR-223 mimics transfection. HIF-1α protein levels were quantified (lower left panel). RT-qPCR was performed to determine Hif1a mRNA expression in Hepa1-6 cell after miR-223 mimics transfection (lower right panel). (C) WT and miR-223KO mice were treated with DEN+CCl4 as described in Figure 1. Representative images of HIF-1α staining in HCC samples from miR-223KO and WT mice are shown. Tumor region was surrounded by dashed line (T: tumor region). (D, E) Tumor and adjacent non-tumor samples from miR-223KO and WT mice were subjected to RT-qPCR (panel D) and western blot analysis (panel E). (F) RT-qPCR analyses of HIF-1α target genes in samples from miR-223KO and WT mice after DEN+CCl4. (G) Correlation analysis of Hif1a expression in tumor samples and PD-1/PD-L1 (Pdcd1/Cd274) expression in non-tumor (NT) adjacent liver tissues from DEN+CCl4 challenged WT (n=11; blue dots) and miR-223KO (n=8; red dots) mice. The average value from WT mice was set as 1. Values represent means ± SEM. *P< 0.05, **P< 0.01, ***P< 0.001.
