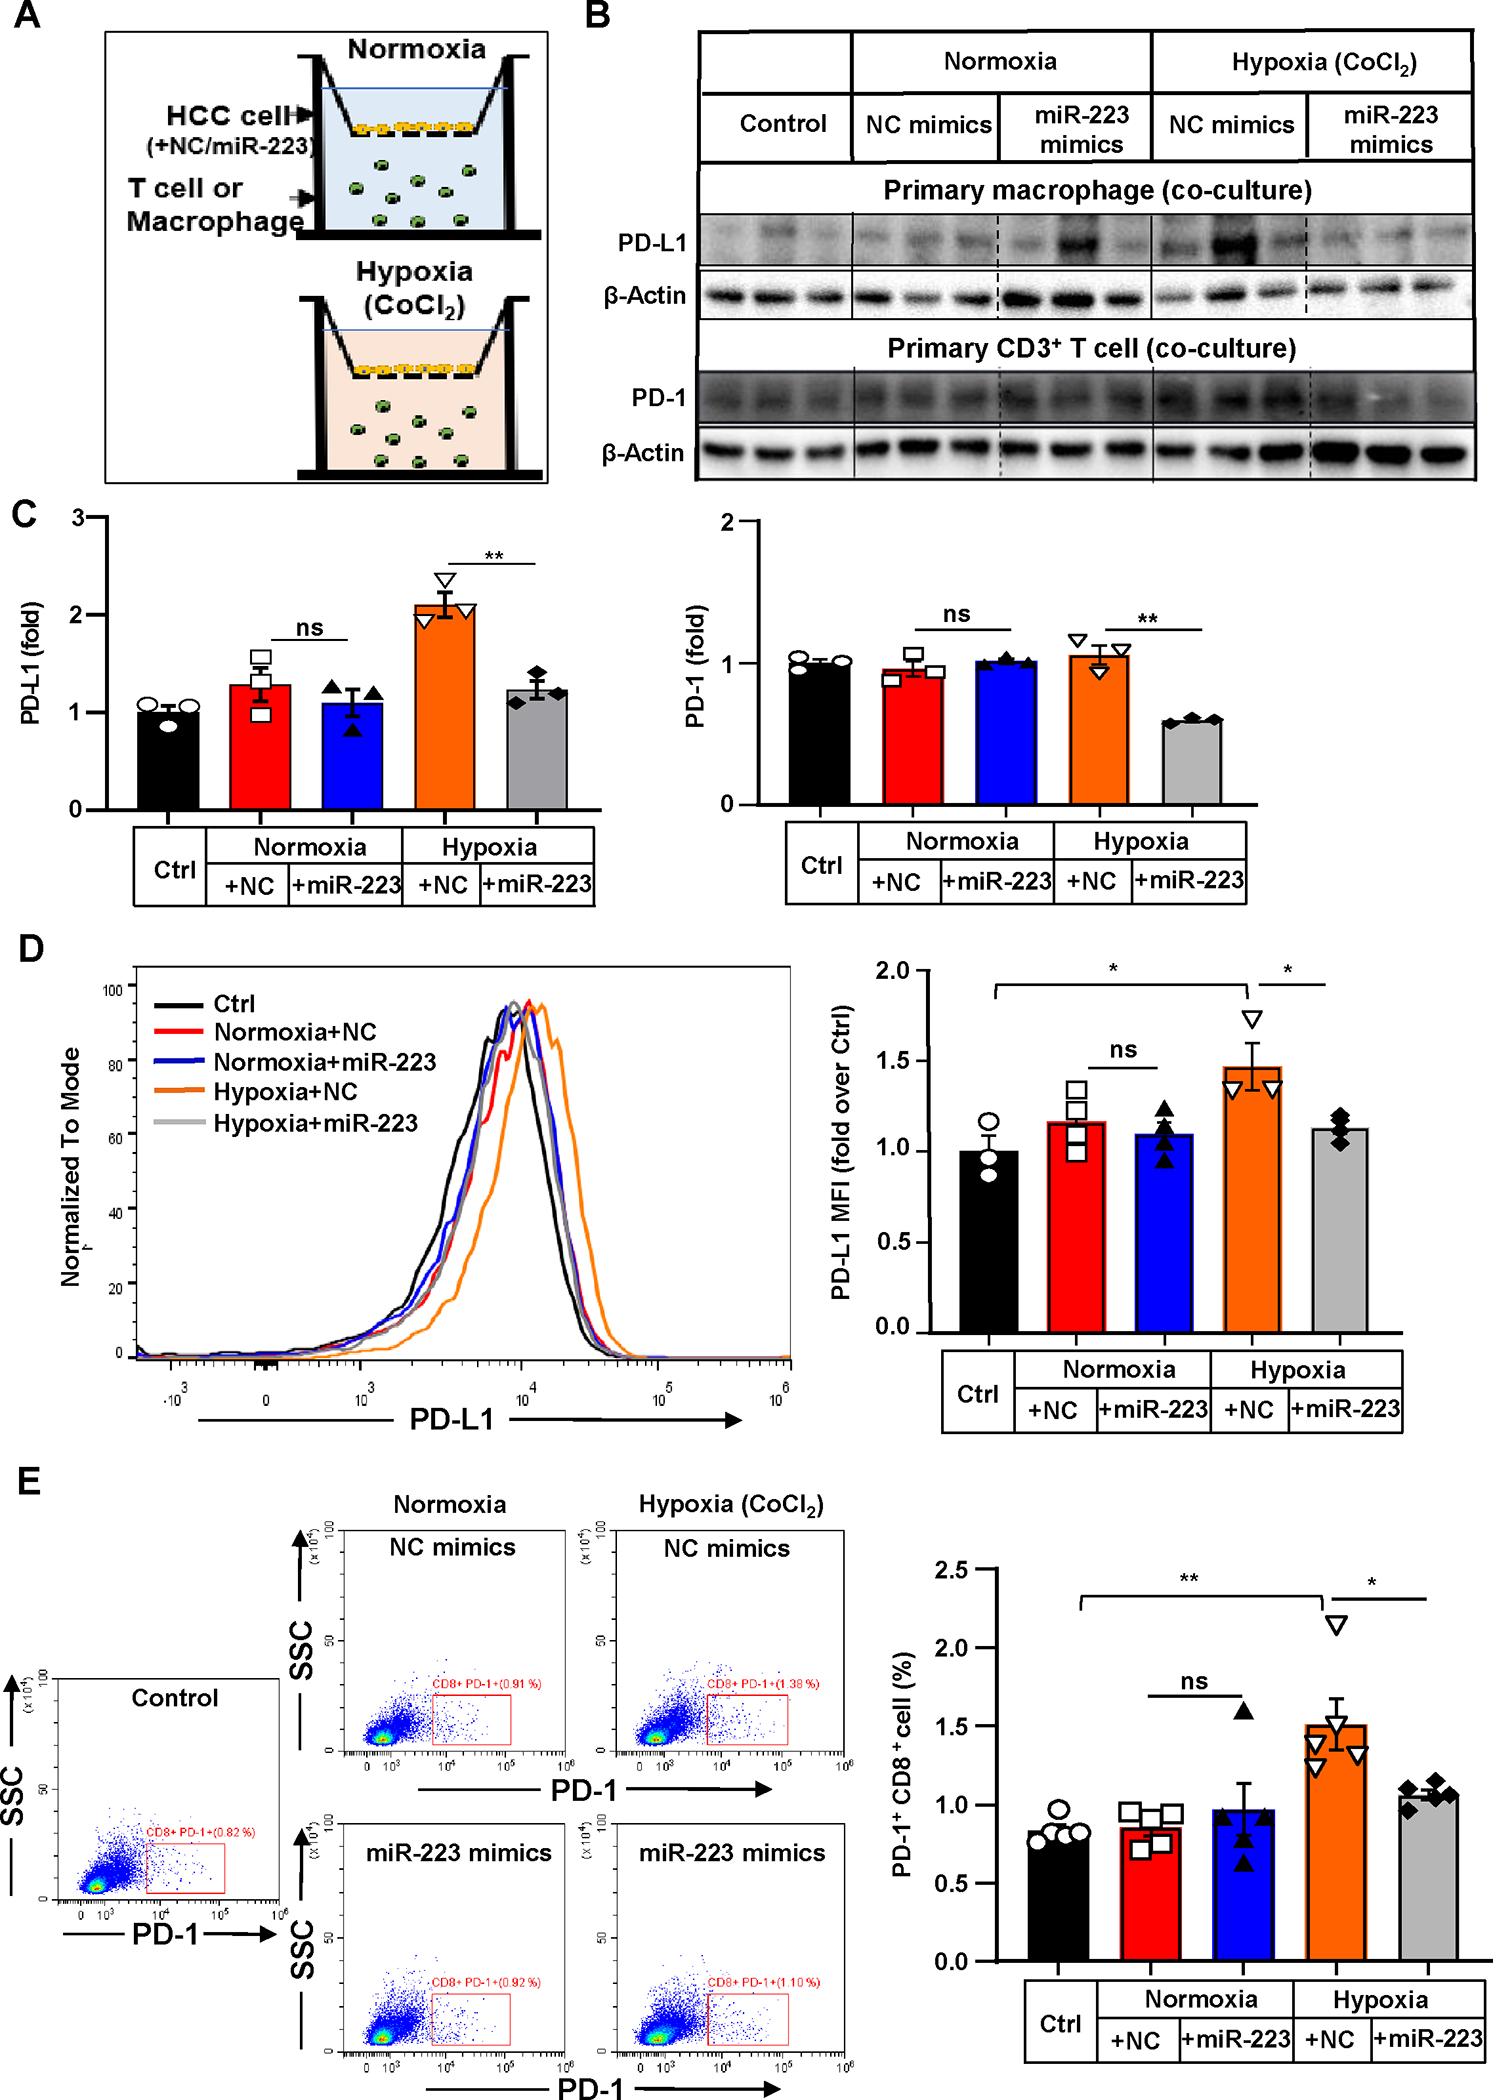
Figure 5. MiR-223 downregulates PD-1 and PD-L1 expression by targeting HIF-1α-mediated hypoxia in HCC.

(A) Scheme of co-culture of primary T cells or macrophages with Hepa1-6 cells under normoxia and CoCl2-induced hypoxia. Hepa1-6 cells were transfected with miR-223/NC mimics in vitro prior to establishment of co-culture system. (B, C) PD-1 expression in T cells or PD-L1 expression in macrophages were determined and quantified by western blot analysis. T cells or macrophages without any stimuli were set as control. (D) Representative flow cytometry analysis and quantification of PD-L1 expression of co-cultured primary macrophages. Mean Fluorescent Intensity (MFI) of PD-L1 was quantitated. (E) Representative flow cytometry analysis of PD-1 expression of co-cultured T cells. The percentage of PD-1+ cells was quantified. Values represent means ± SEM. *P< 0.05, **P< 0.01.
