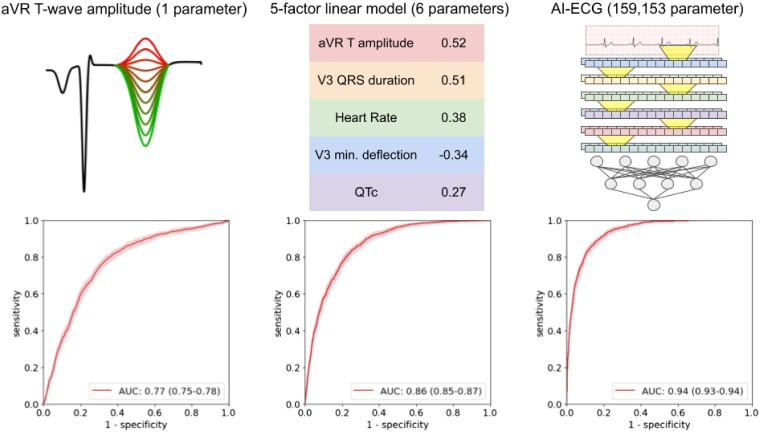
Figure 1.
Receiver operator characteristic curves for three risk scores for detecting left ventricular systolic dysfunction. Left: the amplitude of the T wave in Lead aVR, used directly as a risk score for left ventricular systolic dysfunction. Centre: a linear model based on five electrocardiogram measurements. Weights based on normalized measurements are shown. Right: a deep learning model based on the electrocardiogram waveform (diagram is a simplification for illustrative purposes only).

