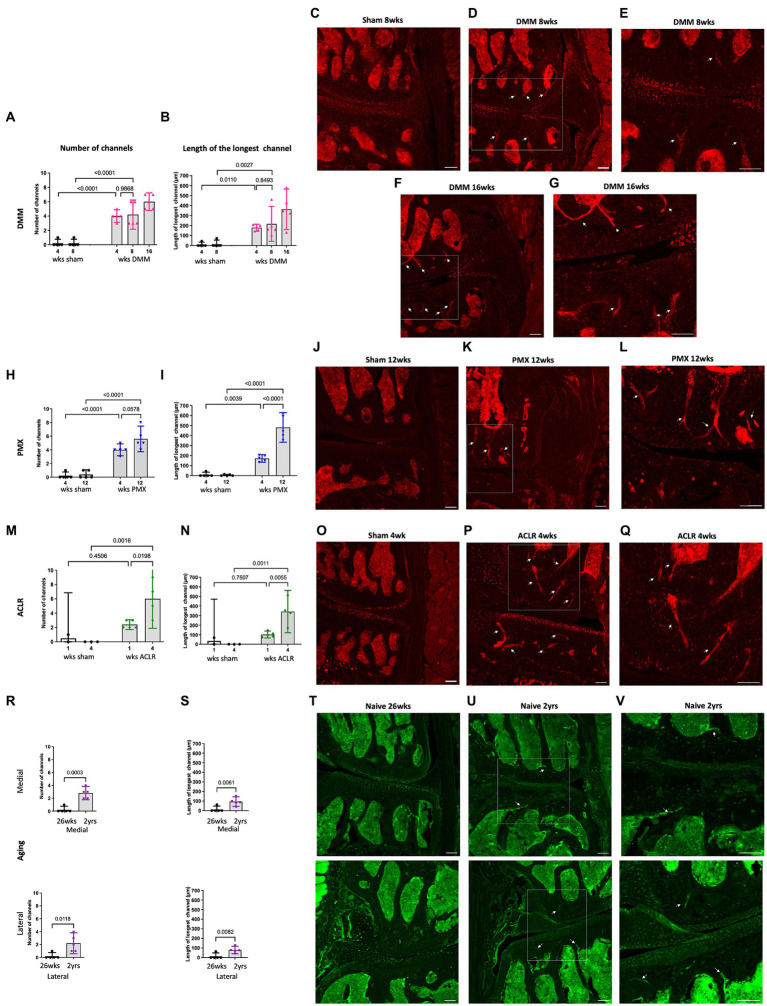
Figure 3.
Quantification of neuronal signal in the medial subchondral bone 4, 8 and 16 weeks after sham and DMM surgeries showing (A) the number of NaV1.8 + channels; (B) the length of the longest channel; (C–E) Representative confocal images of NaV1.8-tdTomato mouse knees showing fibers within medial subchondral bone channels (white arrows) at 8 weeks after sham and 8 and 16 weeks after DMM surgery; (E,G) magnified image of medial subchondral bone fibers at 8 and 16 weeks after DMM; (H,I) quantification of the number of positive channels and the length of the longest channel, respectively, at 4 and 12 weeks after sham and PMX surgeries; (J–L) 4 weeks after sham, 4 weeks after PMX surgery, and zoomed in image, respectively; (M,N) quantification of the number of positive channels and the length of the longest channel, respectively; (O–Q) 1 week after sham, 1 week after ACLR injury, and zoomed in image, respectively; (R,S) quantification of the number of positive channels and the length of the longest channel, respectively, in 26-week old and 2-year old naïve mice in the medial and lateral compartment; (T–V) PGP9.5 staining in the medial and lateral compartment of 26-week old mice, 2-year old naïve mice, and zoomed in image, respectively. Mean ± 95% CI. Scale bar = 100 μm.

