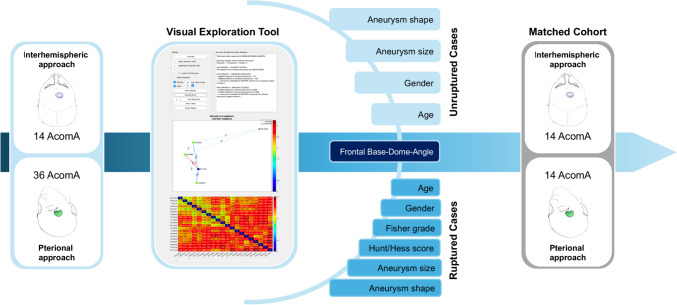
Fig. 4.
Schematic representation of the matching process following cohort identification. The figure illustrates how 14 through AIA operated AcomA were matched with 36 pterionally approached AcomA using the Visual Exploration Tool. To facilitate the matching process, we carefully selected specific parameters that could potentially influence the postoperative outcome for both ruptured and unruptured cases. The final matched cohort consisted of the 14 AcomA operated via the AIA and the 14 best-matching pterionally approached AcomA

