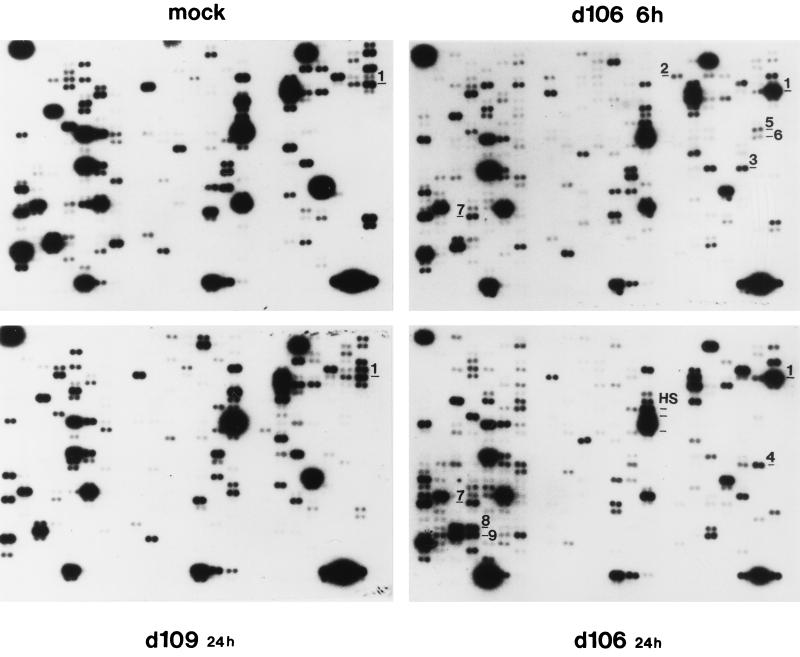
FIG. 4.
Cellular gene expression patterns following infection with d106 and d109. Expression array analysis of mock-infected (A), d106-infected (B), and d109-infected (C) HEL cells was performed as described in Materials and Methods. Poly(A)+ mRNA from mock-infected or infected cells was used to generate [32P]dATP-labeled cDNA which was hybridized to each ATLAS filter, respectively. Changes were identified by inspection of autoradiograms resulting from multiple experiments with different filter sets. Shown are representative filters for each condition demonstrating changes in expression relative to uninfected cells in 588 genes contained on the filters. Each gene on the array is represented by two adjacent spots. The labels on the filters are described in the text.

