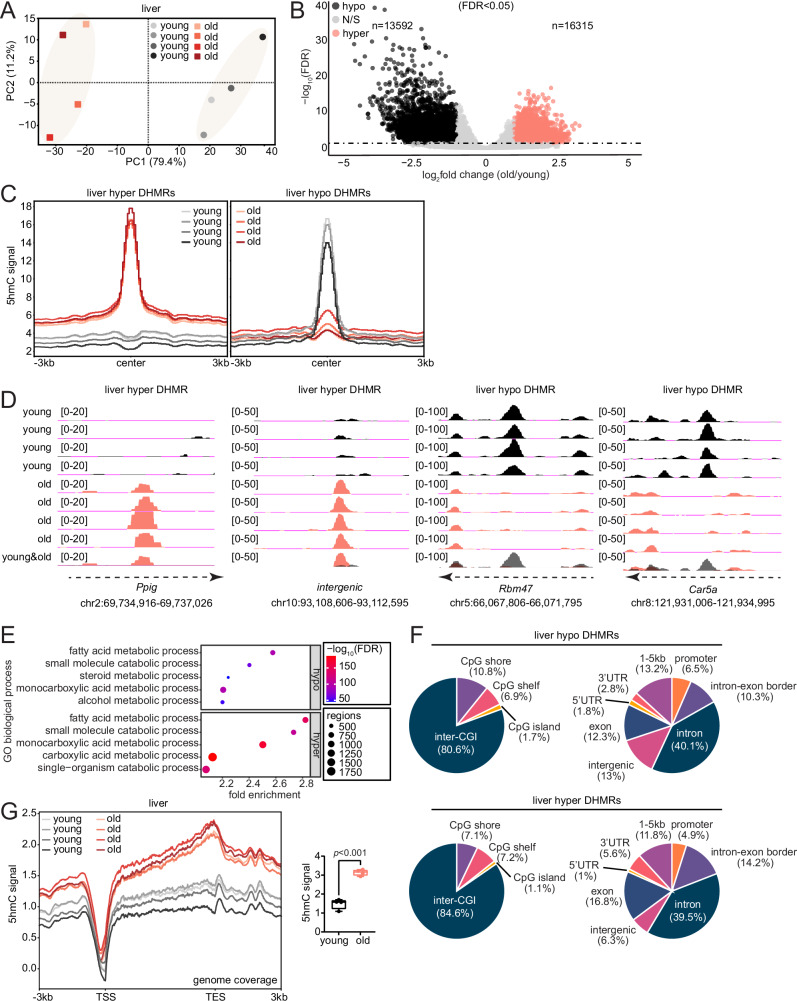
Fig. 2. 5hmC accumulates at genic regions associated with hepatic metabolism during aging.
A Principal component analysis (PCA) plot using input subtracted 5hmC bigWig files of young and old (n = 4 each) mice liver. B Volcano plot of differentially hydroxymethylated regions (DHMRs) between old and young (n = 4 each) mouse liver; identified by QSEA with an FDR < 0.05. Hypo DHMRs (FC ≤ −2) are regions with less enrichment in the old and hyper DHMRs (FC ≥ 2) are regions with higher enrichment in the old. C Metaplots of young and old (n = 4 each) mouse liver 5hmC signal at the DHMRs identified by QSEA. D Example genome browser tracks for mouse liver hyper DHMRs (Ppig and an intergenic region) and hypo DHMRs (Rbm47 and Car5a). E Gene ontology (GO) terms associated with the DHMRs from (B) using GREAT. The top 5 biological process terms with FDR < 0.05 are shown. F Pie charts showing CpG and genic/intergenic annotations of the DHMRs from (B). G Metaplots of young and old (n = 4 each) mouse liver 5hmC signal over the gene bodies of all mm10 genes; signal quantifications are shown on the side. Statistical significance was assessed using two-sided unpaired Welch’s t-test. For the box plot, the horizontal line within each box represents the 50th, while the bounds of the box depict the 25th and 75th percentile of the data. The whiskers extend to the minima (the smallest value within 1.5 times the interquartile range (IQR) below the first quartile, excluding outliers) and the maxima (the largest value within 1.5 times the IQR above the third quartile, excluding outliers). Source data are provided as a Source Data file.

