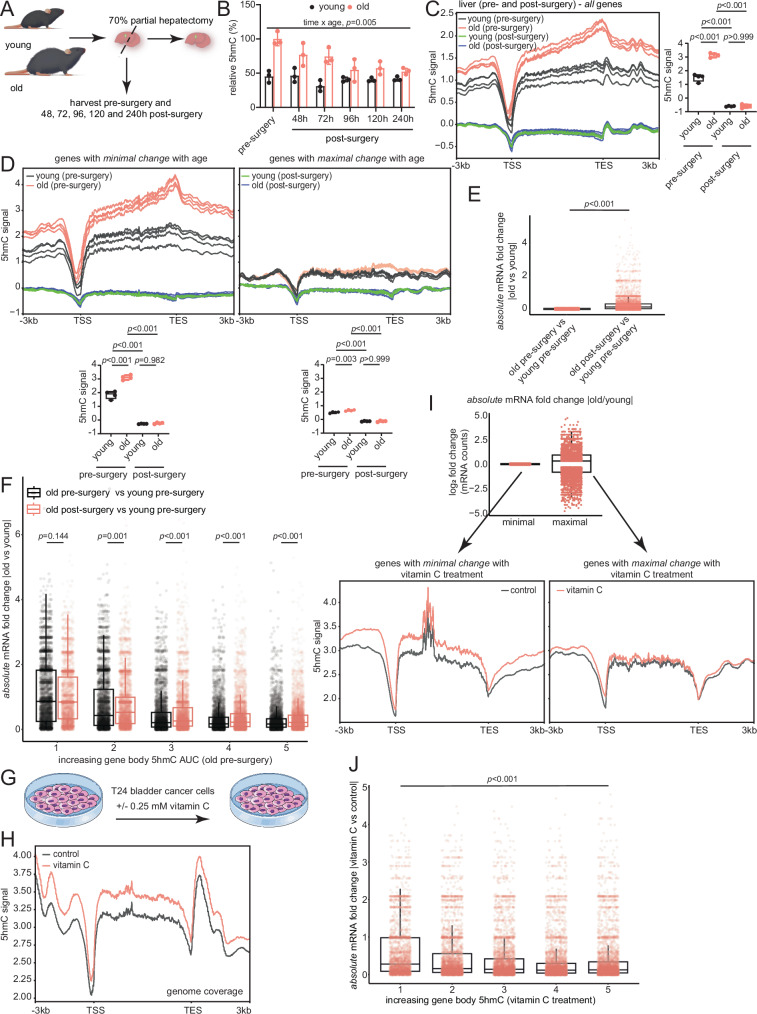
Fig. 6. Altering 5hmC levels affects transcriptional magnitude.
A Schematic for 70% partial hepatectomy. B Relative global 5hmC signal for young and old (n = 3 each) mouse liver samples at the indicated times. Data are presented as mean ± SD. Statistical significance was assessed using two-way ANOVA with Geisser-Greenhouse correction. C Metaplot of 5hmC signal over bodies of all mm10 genes for indicated groups. Quantifications are shown on the side. D Metaplot of 5hmC signal across genes bodies with minimal (left) and maximal (right) expression changes between old pre-surgery vs young pre-surgery (n = 3 each) mRNA comparisons. Quantifications are shown below. For (C-D), statistical significance was assessed using one-way ANOVA with Tukey’s multiple comparisons post-hoc test. E Box plots showing transcriptional changes for “genes with minimal change with age” (from D, left). Statistical significance was assessed using Mann–Whitney U test. F Box plots showing transcriptional changes for indicated group comparisons. Statistical significance was assessed using a Mann–Whitney U test with FDR correction (Benjamini-Hochberg). G Schematic showing vitamin C treatment in T24 bladder cancer cells from Peng et al.64. H Metaplot of 5hmC signal over the bodies of all hg19 genes in vitamin C-treated T24 cells and untreated controls (n = 1 each). I Box plots showing absolute mRNA FC distribution of genes with minimal and maximal expression changes in vitamin C-treated T24 cells vs untreated controls (n = 2 independent cell cultures)64. Below, metaplot of 5hmC signal across gene bodies with minimal (left) and maximal (right) expression changes. J Box plots showing transcriptional changes for all genes in vitamin C-treated T24 cells vs untreated controls (n = 2 independent cell cultures per group). Statistical significance was assessed using one-way ANOVA. For all box plots, the horizontal line within each box represents the 50th, while the bounds of the box depict the 25th and 75th percentile of the data. The whiskers extend to the minima (the smallest value within 1.5 times the IQR below the first quartile, excluding outliers) and the maxima (the largest value within 1.5 times the IQR above the third quartile, excluding outliers). Source data are provided as a Source Data file. Illustration credit: Endosymbiont GmbH.

