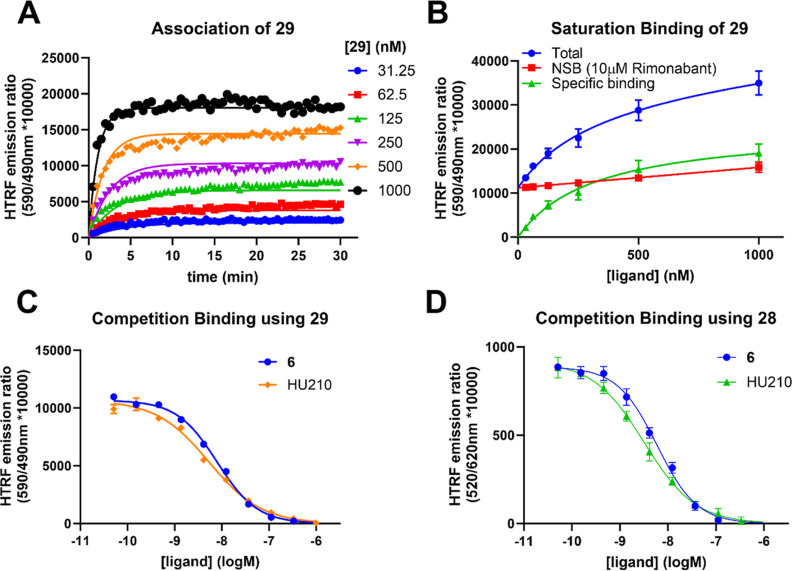
Figure 5.
TR-FRET binding assays using HEK293TR-hCB1R cell membranes. (A) Observed association curves of TAMRA probe 29 to hCB1R. (B) Saturation binding analysis of 29 to hCB1R after 60 min. (C) Competition binding using 29 (300 nM) as a tracer with increasing concentrations of CB1R ligand 6 and HU210. (D) Competition binding using NBD probe 28 (60 nM) as a tracer with increasing concentrations of CB1R ligand 6 and HU210. Kinetic and equilibrium data were fitted to the equations described in the Supporting Information to calculate KD, kon, and koff values for fluorescent and unlabeled ligands. Data are presented as mean ± SEM, N = 3.

