
Figure 8.
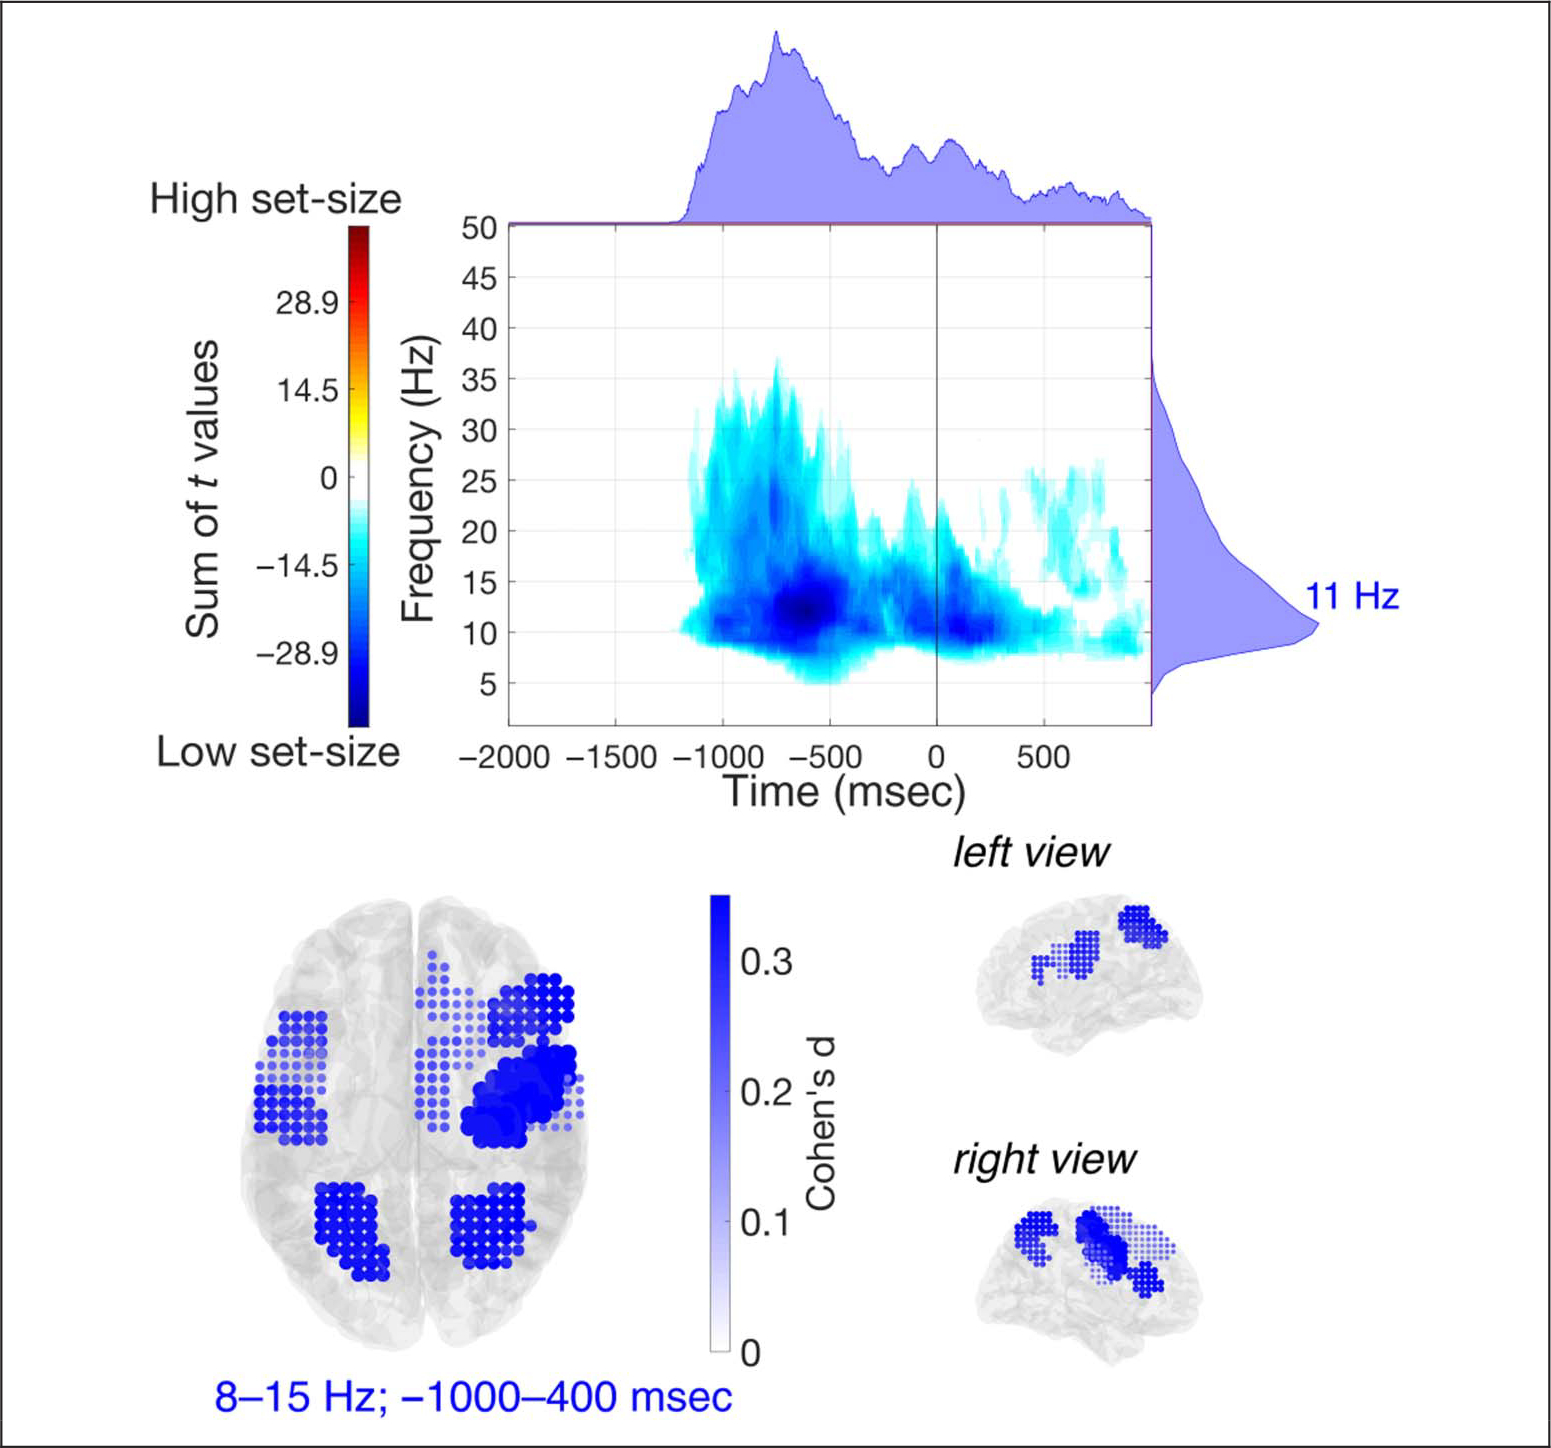
Response-locked analyses for the set-size contrast. Results of the EEG power analyses comparing high set-size and low set-size (response-locked) in source-space. The top figure shows the time–frequency distribution of the sum of between-conditions differences, from the clusters found in the observed data, and the marginal plots on top and on the right represent, respectively, the time distribution (frequency-collapsed) and frequency distribution (time-collapsed) of those differences. The bottom figures show the distribution of the effect sizes of the differences (in ROIs).