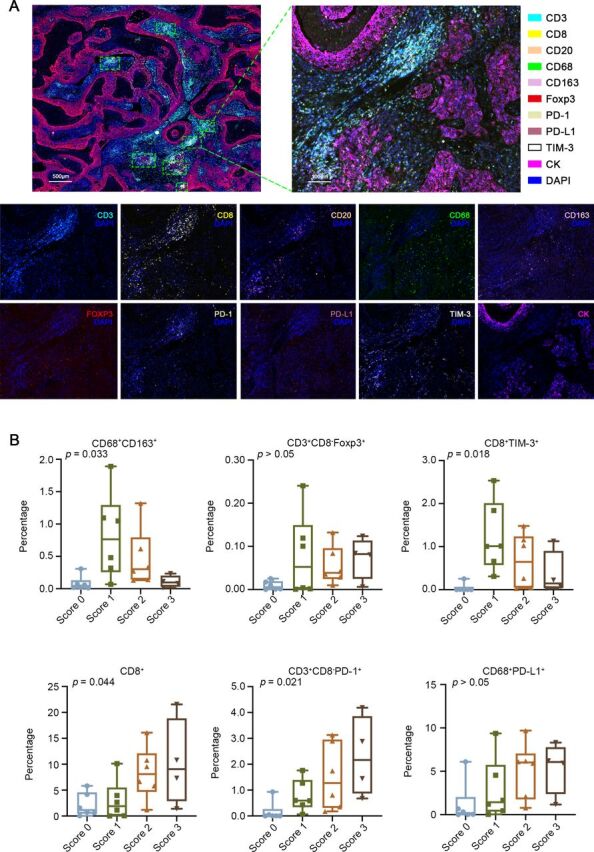
Figure 5.

The heterogeneous distribution of immune cells within TLSs. (A) Representative multiplex immunofluorescence images showing the positivity of CD3, CD8, CD20, CD68, CD163, Foxp3, PD-1, PD-L1, TIM-3, and CK in intratumoral TLSs. (B) Comparison of the percentage of specific cell types among DAPI-positive cells using one-way ANOVA. ANOVA, analysis of variance; CD, cluster of differentiation; CK, cytokeratin; DAPI, 4′,6-diamidino-2-phenylindole; PD-1, programmed cell death protein 1; PD-L1, programmed death-ligand 1; TIM-3, T cell immunoglobulin domain and mucin domain-3; TLS, tertiary lymphoid structure.
