. 2024 Jul 26;12(7):e008721. doi: 10.1136/jitc-2023-008721

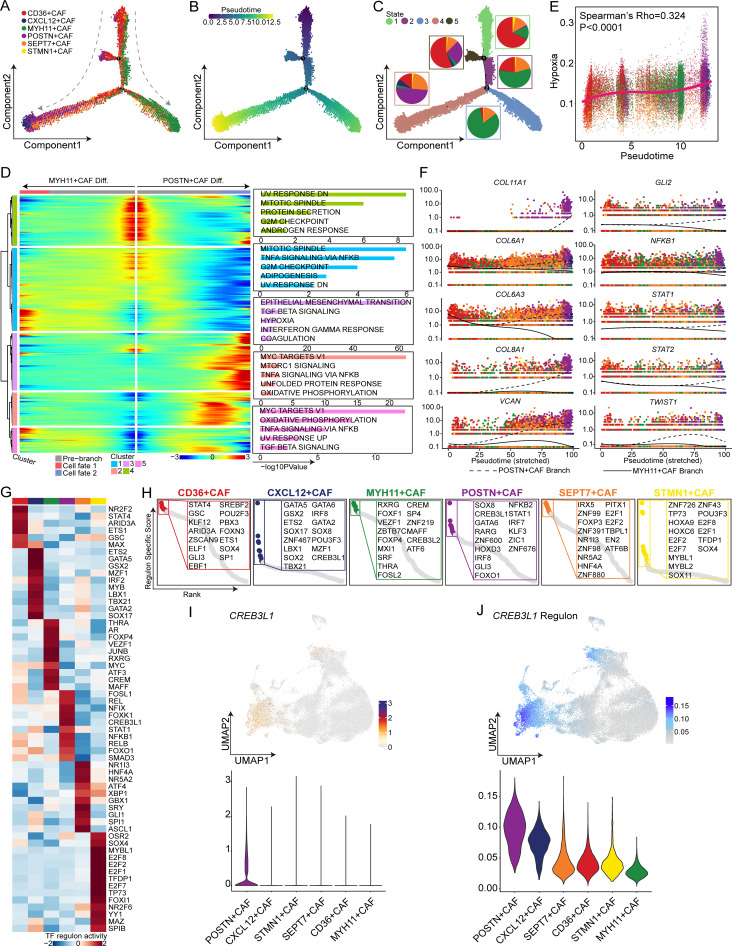
Figure 3. Trajectory analysis of cancer-associated fibroblast (CAF) subtypes in hepatocellular carcinoma. (A) The developmental trajectory of CAFs was inferred by monocle 2 and colored according to the subtype. (B) The pseudotime of the developmental trajectory. The colors from purple to yellow indicate values from low to high, respectively. (C) The inferred states of the trajectory. The proportions of CAF subtypes are shown in the circles with different colors representing different CAF subtypes, and each circle color represents a different state. (D) Expression heatmap of significant (q<1e-3) genes based on branch expression analysis comparing the two CAF cell fates (left). Box plots showing the top five significantly enriched hallmark pathways in each gene cluster (right). (E) Dot plot showing Spearman’s correlation of the pseudotime and hypoxia scores, with different colors representing different CAF subtypes. (F) Pseudotime projections of transcriptional changes in extracellular matrix-associated genes and hypoxia-associated genes between the two trajectory branches. (G) Heatmap showing the mean activity of the top differentially activated regulons in each CAF subtype inferred by pyscenic. (H) Dot plots showing the top 15 specific activated transcription factors ranked by the regulon-specific score in each CAF subtype. (I) Uniform manifold approximation and projection (UMAP) plot (up) and violin plot (bottom) showing the expression of CREB3L1. (J) UMAP plot (up) and violin plot (bottom) showing the activity of the CREB3L1 regulon.

Figure 3