. 2024 Jul 26;12(7):e008721. doi: 10.1136/jitc-2023-008721

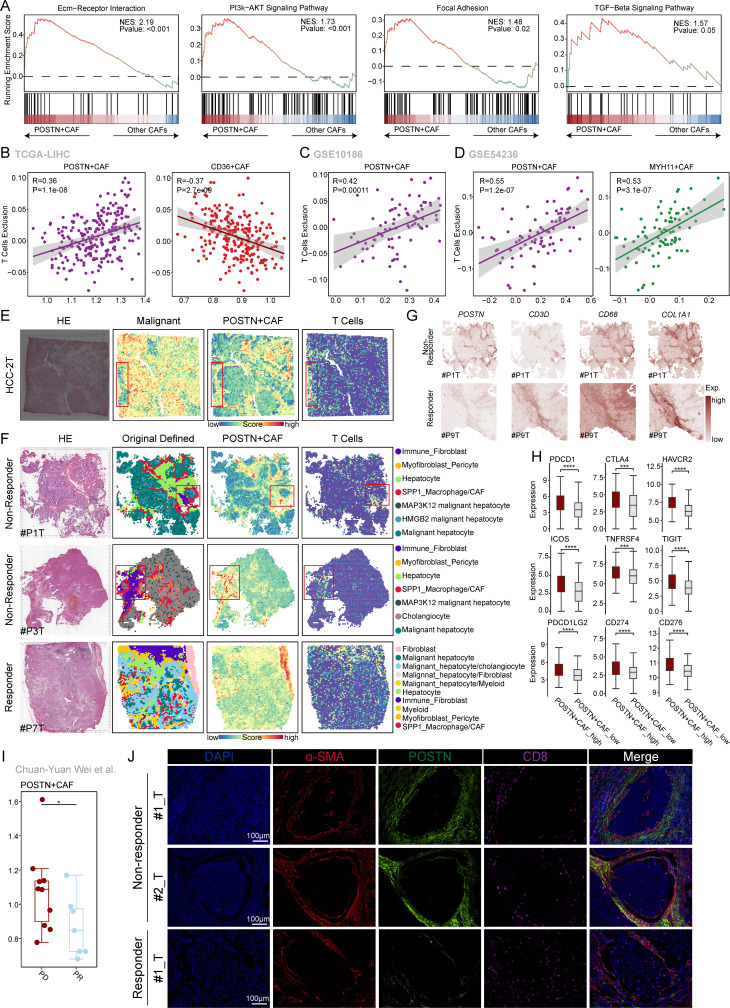
Figure 4. POSTN+ CAFs were associated with T-cells exclusion. (A) Gene set enrichment analysis (GSEA) of the ECM-receptor interaction, PI3K-AKT signaling, focal adhesion, and TGF-beta signaling pathways between POSTN+ CAFs and other CAFs. The genes were ranked by fold change in expression between these two conditions. (B–D) The correlation between the ssGSEA score of each CAF subtype and T-cell exclusion score in the TCGA-LIHC cohort (B), GSE10186 (C), and GSE54236 cohort (D). (E) Spatial HE staining and spatial feature plots of the signatures of malignant cells, POSTN+ CAFs and T cells in HCC-2T tissue sections (from left to right). (F) HE staining of tumor tissues from immune checkpoint blockade (ICB) non-responders and responders at ST spots (left). Original defined cell types in ICB-treated non-responder and responder tumor tissues (middle). Spatial feature plots of the signatures of POSTN+ CAFs and T cells in the tumor tissue of ICB-treated non-responders and responders (right). (G) Enhanced spatial feature plots showing the expression of POSTN, CD3D, CD68, and COL1A1 in ICB non-responder and ICB responder tumor tissues. (H) Box plots showing the expression of immune checkpoint-associated genes between the POSTN+ CAFs with high infiltration group and the POSTN+ CAFs with low infiltration groups in the TCGA-LIHC cohort. The Wilcoxon rank-sum test was used to assess the differences. (I) Box plots showing the difference in the POSTN+ CAF ssGSEA score between the PD and PR anti-PD1 treatment groups. The Wilcoxon rank-sum test was used to assess the differences, and the p value was ≤0.05.* (J) Representative IF staining of anti-PD1 responder and non-responder tissues. DAPI (blue), α-SMA (red), POSTN (green), and CD8 (purple) are shown in individual and merged channels. Bar, 100 µm. CAFs, cancer-associated fibroblasts; ECM, extracellular matrix; PD, progressive disease; PR, partial response; TGF-beta, transforming growth factor beta.

Figure 4