. 2024 Jul 24;12(7):e009550. doi: 10.1136/jitc-2024-009550

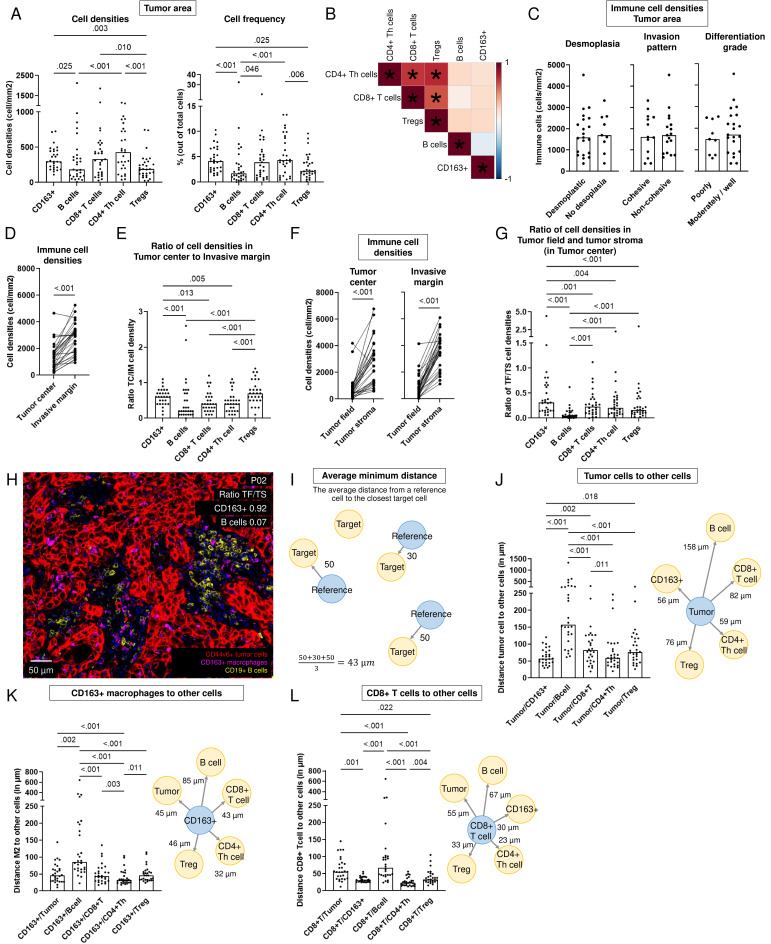
Figure 4. Spatial tumor immune microenvironment of 29 HPV-negative head and neck squamous cell carcinoma (HNSCC) resection specimens. (A) Densities (in cells/mm2) and frequency of total cells in tumor area of CD163+macrophages, B cells, CD8+T cells, CD4+T helper cells and Tregs. A paired non-parametric Friedman test was performed with uncorrected Dunn’s test to obtain p values. Bars represent the median. (B) Pearson correlation matrix with correlation coefficient from −1 (blue) to 1 (red) of immune cell densities in tumor area of 29 HPV-negative HNSCC resection specimens. P values<0.05 indicated with *. (C–D) Immune cell density (in cells/m2, y-axis) (C) across histological parameters (x-axis), p values obtained by an unpaired non-parametric Mann-Whitney test and (D) in the tumor center versus the invasive margin (x-axis), p value obtained by a paired non-parametric Wilcoxon test. (E) Ratio of immune cell density between tumor center (TC) and invasive margin (IM) for CD163+macrophages, B cells, CD8+T cells, CD4+T helper cells and Tregs. A paired non-parametric Friedman test was performed with uncorrected Dunn’s test to obtain p values. (F) Immune cell density (in cells/m2, y-axis) in tumor fields and tumor stroma (x-axis) of the tumor center (left) and in the invasive margin (right), p value obtained by a paired non-parametric Wilcoxon test. (G) Ratio of immune cell density between tumor field (TF) and tumor stroma (TS) in the tumor center for CD163+macrophages, B cells, CD8+T cells, CD4+T helper cells and Tregs. A paired non-parametric Friedman test was performed with uncorrected Dunn’s test to obtain p values. Bars represent the median. (H) Representative image with CD163+macrophages infiltrating into tumor fields and B cells predominantly in the tumor stroma example of tumor with a ratio CD163+macrophages in tumor field to tumor stroma of 0.92 and a ratio B cells in tumor field to tumor stroma of 0.07 (P02). (I) Schematic overview of calculation of the average minimum distance from a reference cell (in blue) to the nearest target cells (in yellow). (J–L) Distance (in µm, y-axis) of (J) Tumor cells, (K) CD163+macrophages and (L) CD8+T cells to other cells in the tumor area (x-axis) in left panels. A paired non-parametric Friedman test was performed with uncorrected Dunn’s test to obtain p values. Bars represent the median. A schematic overview in the right panel with distance from reference to the target cell, median over 29 resection specimens shown. HPV, human papillomavirus; Treg, regulatory T cells.

Figure 4