. 2024 Jul 24;12(7):e009550. doi: 10.1136/jitc-2024-009550

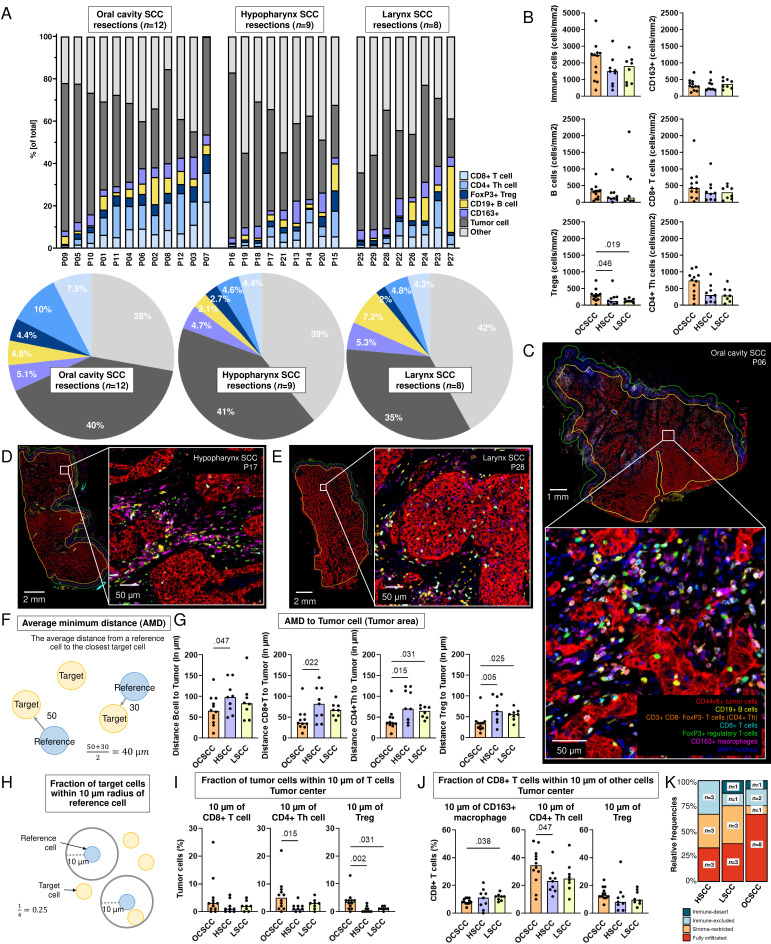
Figure 7. Comparison of 29 human papillomavirus-negative resection specimens from distinct anatomical sites along the head and neck region. (A) Fraction of tumor and immune cells out of total cells (y-axis) in tumor area of surgical resection specimens from patients with oral cavity squamous cell carcinoma (OCSCC, n=12), hypopharynx SCC (HSCC, n=9), and larynx SCC (LSCC, n=8, x-axis). Pie charts of the average percentage of cells in the tumor area of 12 OCSCC (left panel), 9 HSCC (middle panel), and 8 LSCC (right panel) surgical resection specimens. (B) Densities of immune cells in tumor area (cells/mm2, y-axis) of OCSCC, HSCC and LSCC (x-axis). (C–E) Representative images of (C) OCSCC (P06), (D) HSCC (P17), and (E) LSCC (L28) stained with seven-color multiplex immunohistochemistry Opal panel to identify CD44v6+tumor cells, CD163+macrophages, CD19+B cells, CD8+T cells, CD3+CD8− FoxP3− (CD4+T helper (Th)) cells and FoxP3+regulatory T cells (Tregs). (F) Schematic overview of calculation of average minimum distance (AMD) from a reference cell (in blue) to the nearest target cells (in yellow). (G) Distance (in µm, y-axis) of B cells, CD8+T cells, CD4+Th cells, and Tregs to tumor cells in the tumor area from OCSCC, HSCC, and LSCC resection specimens (x-axis). (H) Schematic representation of radius analysis where the fraction of target cells (in yellow) located within 10 µm of a reference cell (in blue) was calculated. (I) Fraction of tumor cells (y-axis) within 10 µm of CD8+T cell, CD4+Th cell, and Treg in tumor center of OCSCC, HSCC, and LSCC resections. (J) Fraction of CD8+T cells (y-axis) within 10 µm of CD163+macrophage, CD4+Th cell, and Treg in tumor center of OCSCC, HSCC, and LSCC resections. Unpaired non-parametric Kruskal-Wallis tests with uncorrected Dunn’s tests were performed to obtain p values, bars represent median values. (K) Relative frequencies and number of specimens (y-axis) classified as fully infiltrated (red), stroma-restricted (orange), immune-excluded (light blue), or immune-desert (dark blue) per anatomical site (x-axis).

Figure 7