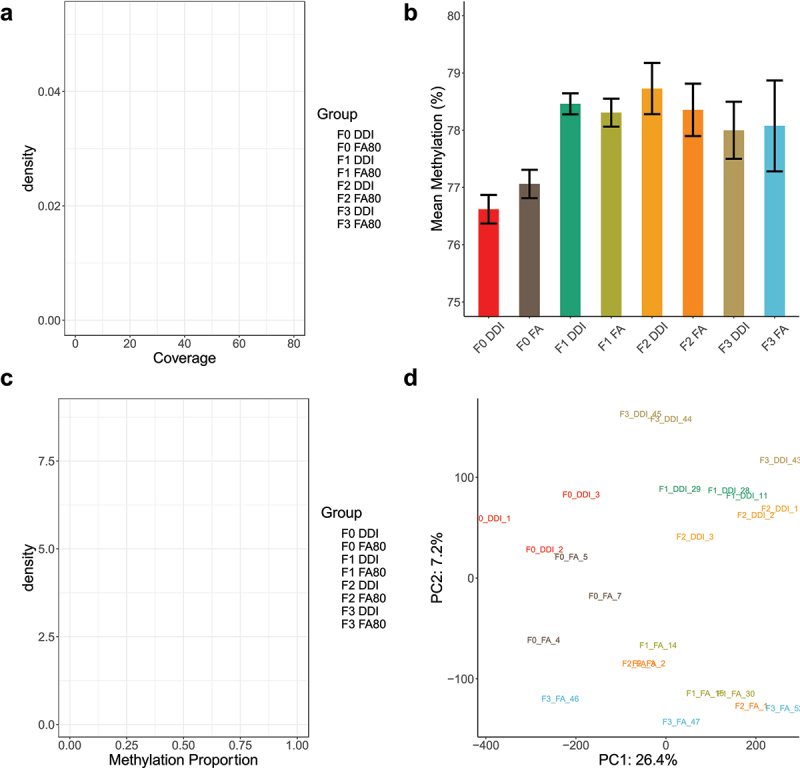
Figure 2.

Global DNA methylation in transgenerational sperm specimens show no significant changes in total methylation levels in untreated generations. (a) A density plot depicts the average read coverage (x-axis) for each of the experimental groups. Coverage depicts the number of sequencing reads covering a given CpG across the genome after collapsing across the 2 DNA strands. Experimental groups are colour-coordinated. (b) A bar plot shows the average genome-wide methylation abundance (%) (y-axis) of biological replicates across all experimental groups and generations (x-axis). (c) A density plot displays the distribution of methylation values (x-axis) and their density (y-axis) of all the tested CpG sites. The distribution of methylation abundance is bimodal, with peaks at 0 (unmethylated) and 1 (fully methylated). Experimental groups are colour-coordinated. (d) A plot shows the distribution of samples plotted against the first 2 principal components following principal component analysis using methylated values from all tested CpG sites.
