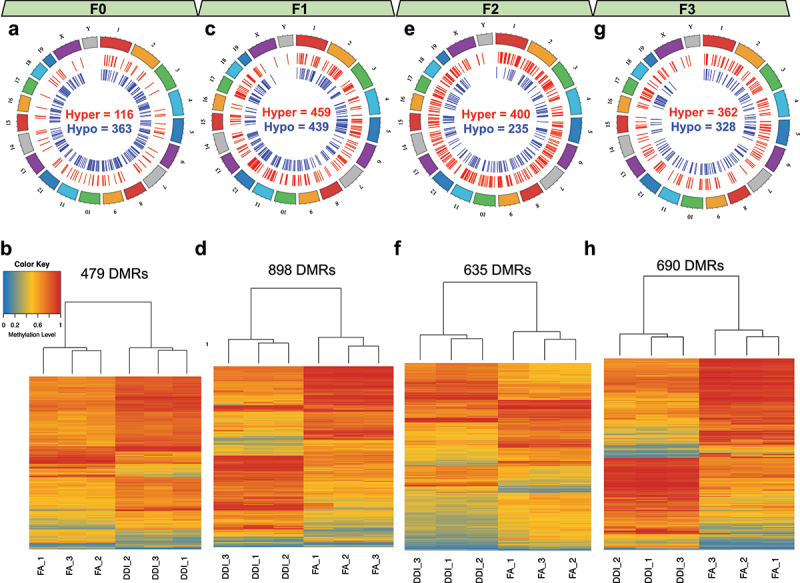
Figure 3.

Transgenerational DMRs after F0 exposure to folic acid are found in each consecutive generation and are able to distinguish DDI- from FA-lineage specimens. (a, c, e, g) Circos plots depict the relative location of DMRs distributed across the genome in the F0 generation (a), the F1 generation (c), the F2 generation (e), and the F3 generation (g). Hypermethylated DMRs are shown in red. Hypomethylated DMRs are shown in blue. (b, d, f, h) Heatmaps show the unsupervised hierarchical clustering of tested samples as determined using the DNA methylation levels from CpGs contained within identified generational DMRs for the F0 generation (b), the F1 generation (d), the F2 generation (f), and the F3 generation (h). Low methylation is depicted in blue. High methylation is depicted in red.
