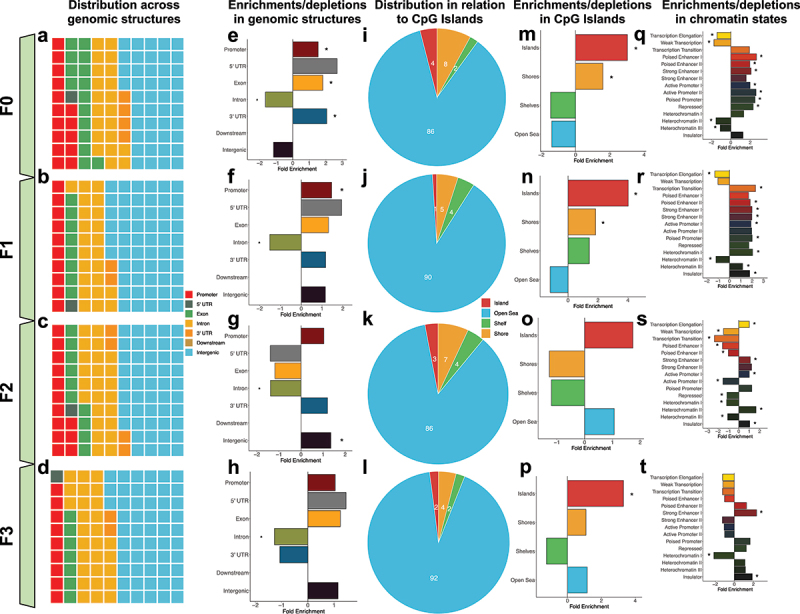
Figure 4.

Transgenerational DMRs are found in regions of the genome known to regulate gene expression, including promoters and in CpG islands. (A-D) Waffle plots show the relative proportion of DMRs located in each of the standard genomic features for each of the tested generations. Genomic features are colour-coordinated. (E-H) Bar plots show the fold enrichment (x-axis) of the transgenerational DMRs, relative to background regions, for each of the genomic features (y-axis). Significant enrichments/depletions are depicted by an asterisk (*) (adjusted P-value <0.05; Fisher’s exact test). (I-L) Pie charts show the proportions of transgenerational DMRs based on their locations relative to CpG islands. DMRs were determined to be either in CpG islands (red), on the shores of CpG islands (yellow), the shelves of CpG islands (green), or distal to CpG islands in the open sea (blue). (M-P). Bar plots show the fold enrichment (x-axis) of the transgenerational DMRs, relative to background regions, for each of the CpG island features (y-axis). Significant enrichments/depletions are depicted by an asterisk (*) (adjusted P-value <0.05; Fisher’s exact test). (Q-T)) Bar plots show the fold enrichment (x-axis) of the transgenerational DMRs, relative to background regions, for each of the varying 15-chromatin states previously identified in the mouse genome (y-axis). Significant enrichments/depletions are depicted by an asterisk (*) (adjusted P-value <0.05; Fisher’s exact test).
