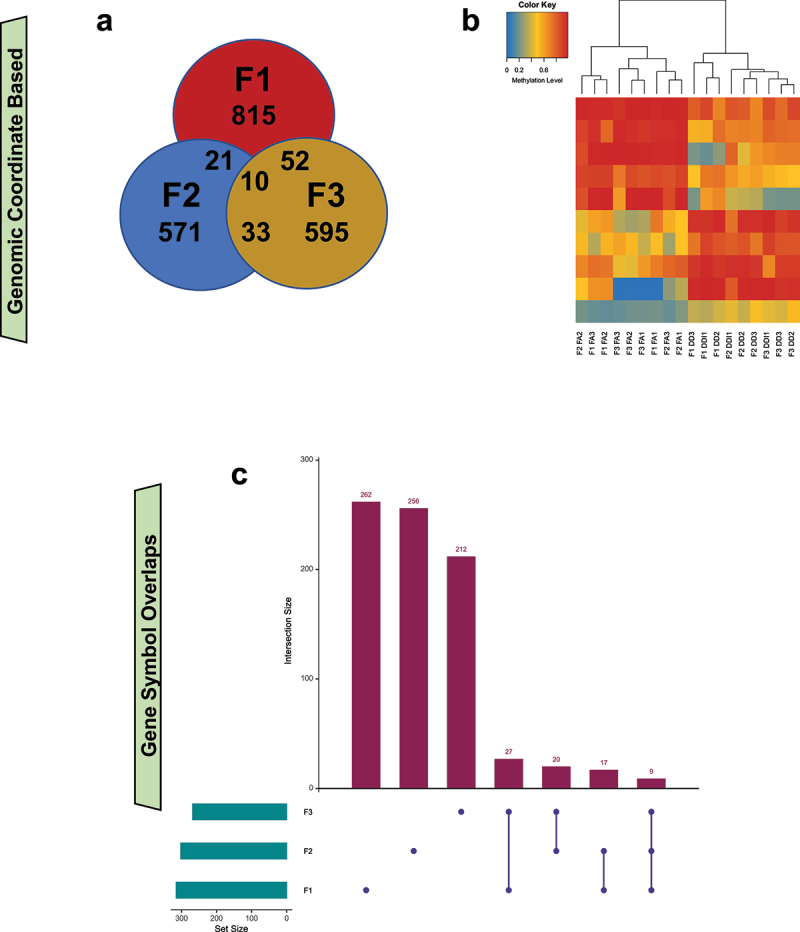
Figure 6.

Transgenerational DMRs in untreated generations overlap at both DMR location and gene-level, suggesting commonality of molecular changes caused by ancestral FA treatment. (a) A Venn diagram depicts the overlap of DMRs, based on genomic coordinates, from the F1 (red), F2 (blue), and F3 (yellow) generations. (b) A heatmap shows the unsupervised hierarchical clustering of tested samples using the mean DNA methylation levels from the 10 transgenerational DMRs that are identified in all 3 generations. (c) An UpSet plot shows the overlap of transgenerational DMR-associated genes between the generations that were not directly treated (i.e., F1–F3). Green bars show the number of DMR-associated genes for each generation. Purple bars show the number of DMR-associated genes specific to each tested overlap.
