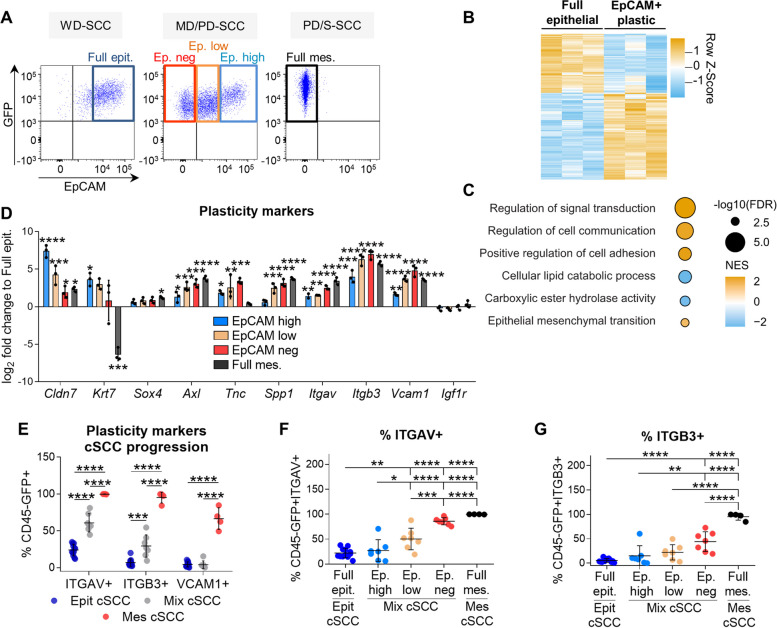
Fig. 1.
Identification of plasticity markers in mouse cSCCs. A Cancer cell populations isolated during mouse cSCC progression based on EpCAM expression: full epithelial (Full epit., GFP+CD45−EpCAMhigh) from WD-SCCs; EpCAMhigh (Ep. high, GFP+CD45−EpCAMhigh), EpCAMlow (Ep. low, GFP+CD45−EpCAMlow) and EpCAMneg (Ep. neg, GFP+CD45−EpCAM−) from MD/PD-SCCs; and full mesenchymal (Full mes., GFP+CD45−EpCAM−) from PD/S-SCCs. B Euclidean hierarchical clustering of differentially expressed genes (log2-FC ≥ 1; FDR P < 0.05) between full epithelial (WD-SCCs) and EpCAM+ plastic (MD/PD-SCCs) cancer cells (n = 3/group). C Gene set enrichment analysis of EpCAM+ plastic vs. full epithelial cancer cells. The color scale represents the normalized enrichment score (NES), and the size of the bubbles the -log10 of the FDR. The signatures selected for this plot belong to Hallmark and Gene Ontology; FDR < 0.05 and NES > 0 for all cell types. D mRNA expression levels (mean ± SD) of plasticity genes in the indicated cancer cells relative to full epithelial cancer cells (n = 3/group). P-value (one-way ANOVA with Dunnett’s test). E Percentage (mean ± SD) of ITGAV+, ITGB3+, and VCAM1+ cancer cells in epithelial (n = 12), mixed (n = 7), and mesenchymal (n = 4) cSCCs. P-value (one-way ANOVA with Tukey’s test). F, G Percentage (mean ± SD) of (F) ITGAV+ and (G) ITGB3+ cells in the indicated cSCC cancer cells. P-value (one-way ANOVA with Tukey’s test)

