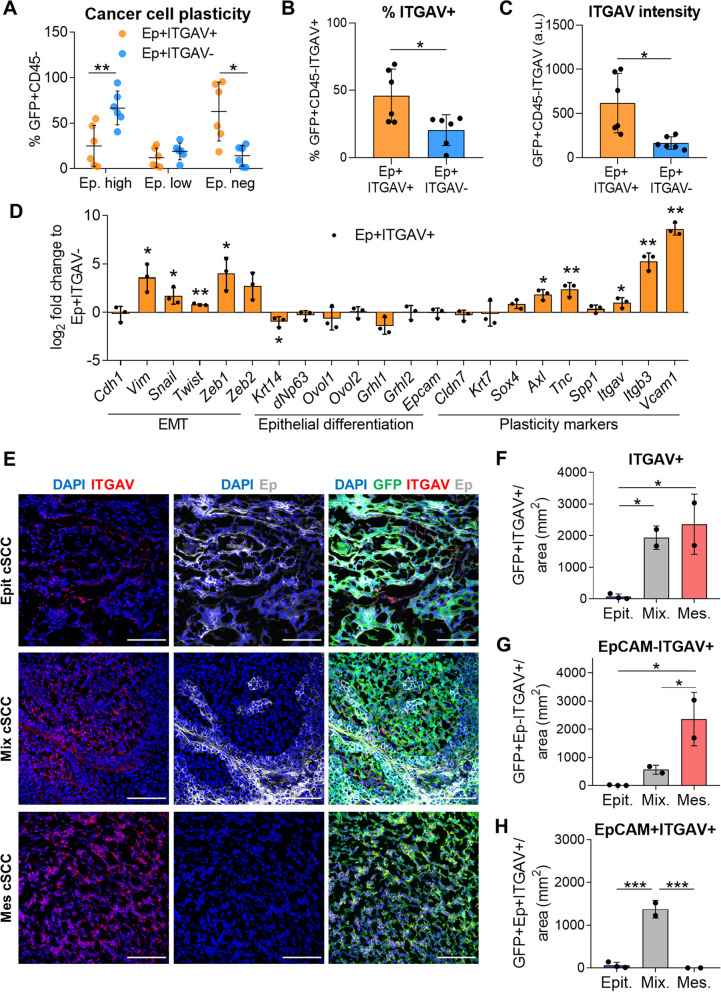
Fig. 2.
ITGAV marker identifies epithelial plastic cancer cells. A Percentage (mean ± SD) of EpCAMhigh, EpCAMlow, and EpCAMneg cancer cells generated after the engraftment of EpCAM+ITGAV+ and EpCAM+ITGAV− cancer cells from mixed cSCCs into immunocompetent syngeneic mice (n = 6/group). P-value (unpaired two-tailed Student’s t-test). B, C (B) Percentage (mean ± SD) of ITGAV+ cancer cells and (C) median ITGAV intensity (mean ± SD) of cancer cells in EpCAM+ITGAV+ and EpCAM+ITGAV−-derived tumors. P-value (unpaired two-tailed Student’s t-test). D mRNA expression levels (mean ± SD) of the indicated genes in EpCAM+ITGAV+ cancer cells relative to EpCAM+ITGAV− cancer cells from mixed cSCCs (n = 3/group). P-value (unpaired two-tailed Student’s t-test). E Representative IF images of GFP (green)/ITGAV (red)/EpCAM (Ep, white)-expressing cells in epithelial, mixed, and mesenchymal cSCCs. Nuclei labelled with DAPI (blue). Scale bar: 100 µM. F–H Quantification (mean ± SD) of (F) GFP+ITGAV+, (G) mesenchymal GFP+EpCAM−ITGAV+, and (H) epithelial GFP+EpCAM+ITGAV+ cancer cells per tumor area (mm2) in epithelial (n = 3), mixed (n = 2), and mesenchymal (n = 2) cSCCs. P-value (one-way ANOVA with Tukey’s test)

