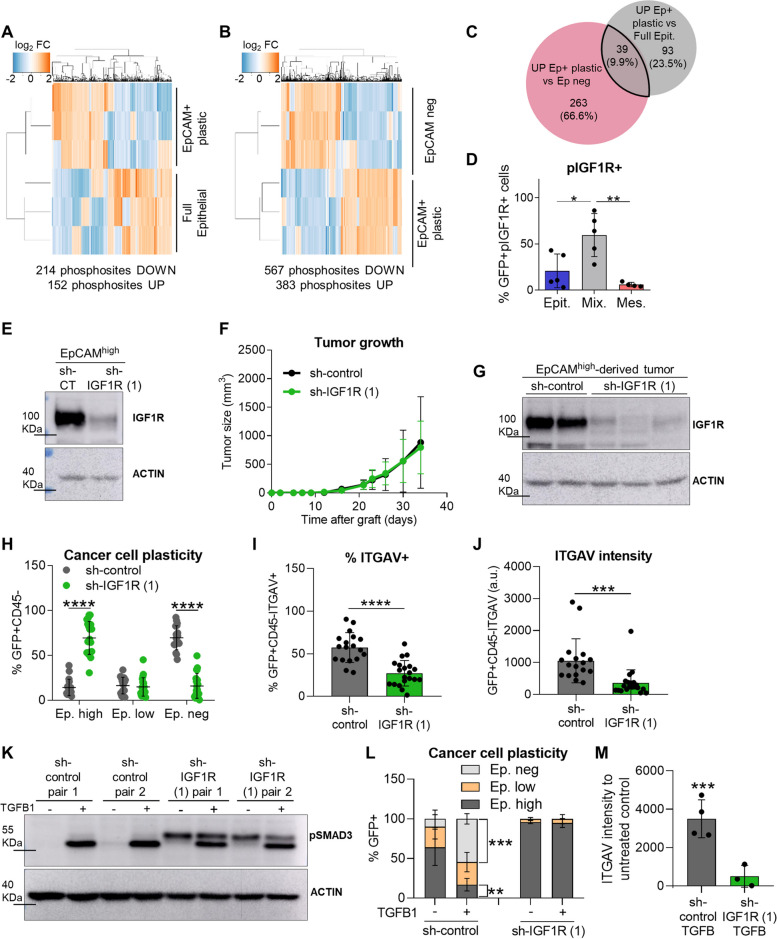
Fig. 5.
pIGF1R promotes EMP acquisition in epithelial cSCC cancer cells. A, B Hierarchical cluster analysis of differentially phosphorylated peptides (FDR p < 0.05) (A) between full epithelial and EpCAM+ plastic cancer cells isolated from WD-SCCs and MD/PD-SCCs, respectively, and (B) between EpCAM+ plastic and EpCAMneg cancer cells isolated from MD/PD-SCCs (n = 3/group). C Venn diagram of the number of proteins specifically phosphorylated in the EpCAM+ plastic signature compared with full epithelial and EpCAMneg cancer cells. D Percentage (mean ± SD) of GFP+pIGF1R+ cancer cells in epithelial (n = 5), mixed (n = 5), and mesenchymal (n = 4) cSCCs, determined by IF assays. P-value (one-way ANOVA with Tukey’s test). E Western blot confirmation of IGF1R knockdown in EpCAMhigh sh-IGF1R (1) cancer cells prior to engraftment into immunocompetent syngeneic mice. Actin was used as a loading control. F Growth kinetics (mean ± SD) of EpCAMhigh sh-control and sh-IGF1R (1)-derived tumors (n ≥ 18/group). P-value (Repeated Measures ANOVA test). G Representative image of IGF1R levels in the indicated cancer cells after tumor growth. Actin was used as a loading control. H Percentage (mean ± SD) of EpCAMhigh, EpCAMlow, and EpCAMneg cancer cells generated after the engraftment of EpCAMhigh sh-control (n = 18) and sh-IGF1R (1) (n = 20) cancer cells into immunocompetent syngeneic mice. P-value (unpaired two-tailed Student’s t-test). I, J (I) Percentage (mean ± SD) of ITGAV+ cancer cells and (J) median ITGAV intensity (mean ± SD) of cancer cells in EpCAMhigh sh-control and sh-IGF1R (1)-derived tumors. P-value (unpaired two-tailed Student’s t-test). K pSMAD3 levels after TGFβ1 (2.5 ng/µl) treatment for 14 days in the indicated cancer cells. Actin was used as a loading control. L Percentage (mean ± SD) of EpCAMhigh, EpCAMlow, and EpCAMneg cancer cells generated in TGFβ1-treated (+) and untreated (-) EpCAM+ plastic sh-control (n = 4) and sh-IGF1R (1) (n = 3) cancer cells. P-value (unpaired two-tailed Student’s t-test). M Median ITGAV intensity (mean ± SD) of sh-control (n = 4) and sh-IGF1R (1) (n = 3) cancer cells treated with TGFβ1 relative to their respective untreated controls. P-value (unpaired two-tailed Student’s t-test)

