
6.
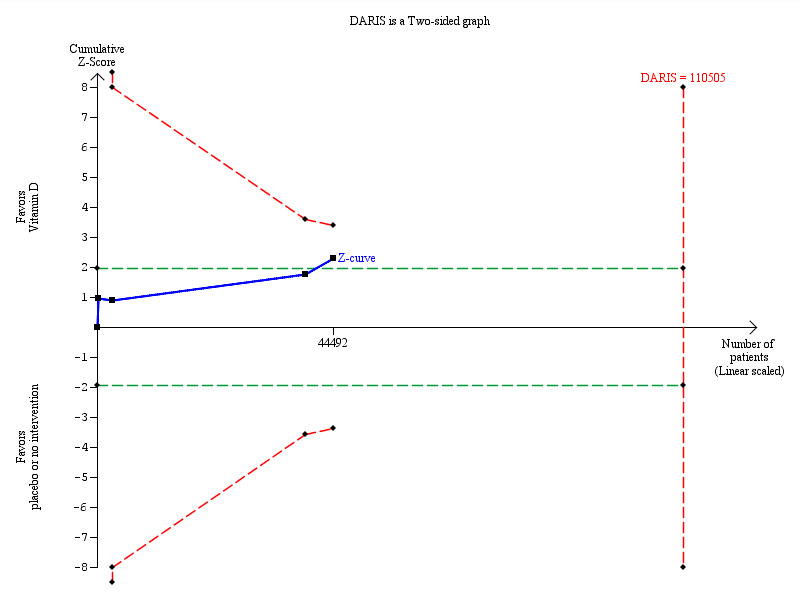
Trial sequential analysis on cancer mortality in the four vitamin D trials was performed based on cancer mortality of 3% in the control group, a relative risk reduction of 10% with vitamin D₃ supplementation, a type I error of 5%, and a type II error of 20% (80% power). There was no diversity. The required information size was 110,505 participants. The cumulative Z‐curve (blue line) did not cross the trial sequential monitoring boundary (red line) after the fourth trial. The blue line represents the cumulative Z‐score of the meta‐analysis. The green lines represent the conventional statistical boundaries. The red inward sloping lines represent the trial sequential monitoring boundaries.