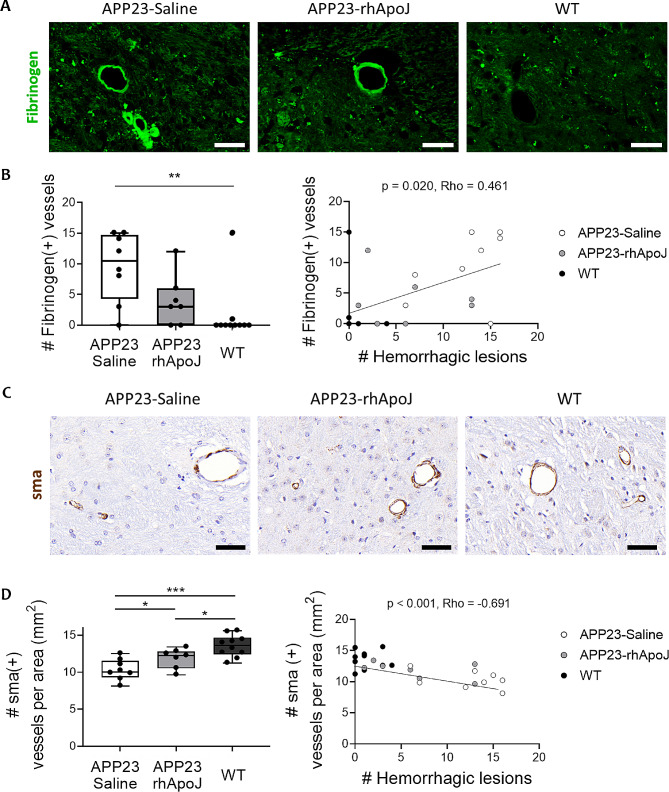
Fig. 2.
(A) Representative images of immunofluorescence staining of fibrinogen in green from brain sections of APP23 mice chronically treated with saline or rhApoJ and WT mice. (B) Graphical quantification of fibrinogen-positive cerebral vessels. Correlation between the number of fibrinogen-positive vessels and the number of cerebral hemorrhagic lesions detected by T2*-MRI. (C) Representative images of immunohistochemical staining of sma in brown from brain sections of APP23 mice chronically treated with saline or rhApoJ and WT mice. (D) Graphical quantification of sma-positive cerebral vessels per mm2. Correlation between the number of sma-positive vessels and the number of hemorrhagic lesions. The scale bar represents 50 μm. Data are presented as boxplots. #: count; *:p < 0.05; **:p < 0.01; ***:p < 0.001

