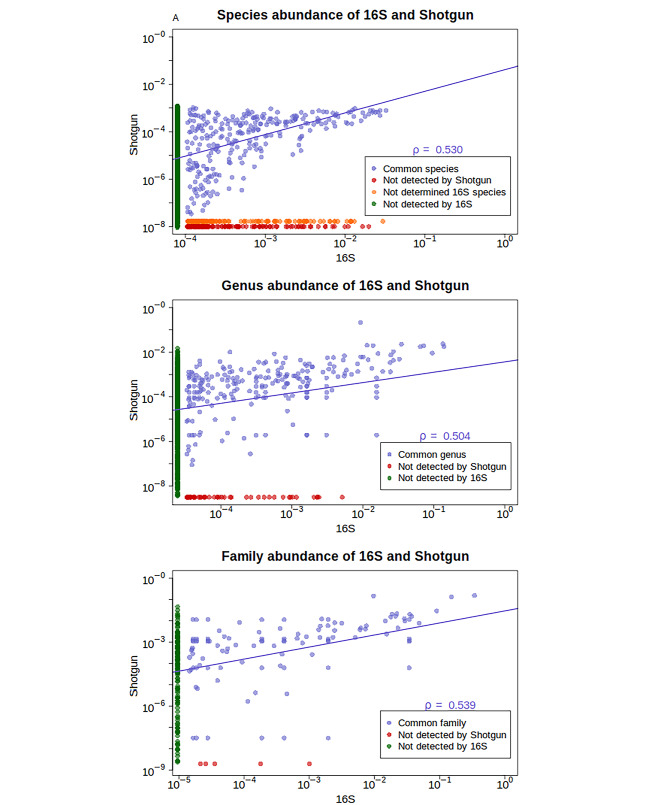
Fig. 2.
Decimal logarithm scatter plot representation of closed geometric means (centre of a composition) of Species, Genus and Families abundances in 16S and shotgun. The strength of the association over shared taxa is estimated with Spearman Correlation Coefficient and represented with a regression line. The blue dots indicate shared taxa, in green we can see the counts of the shotgun taxa that cannot be found in 16S, in red we can find the ones detected by 16S and not by shotgun. Furthermore, the unnamed 16S species are colored in orange

