Figure 3.
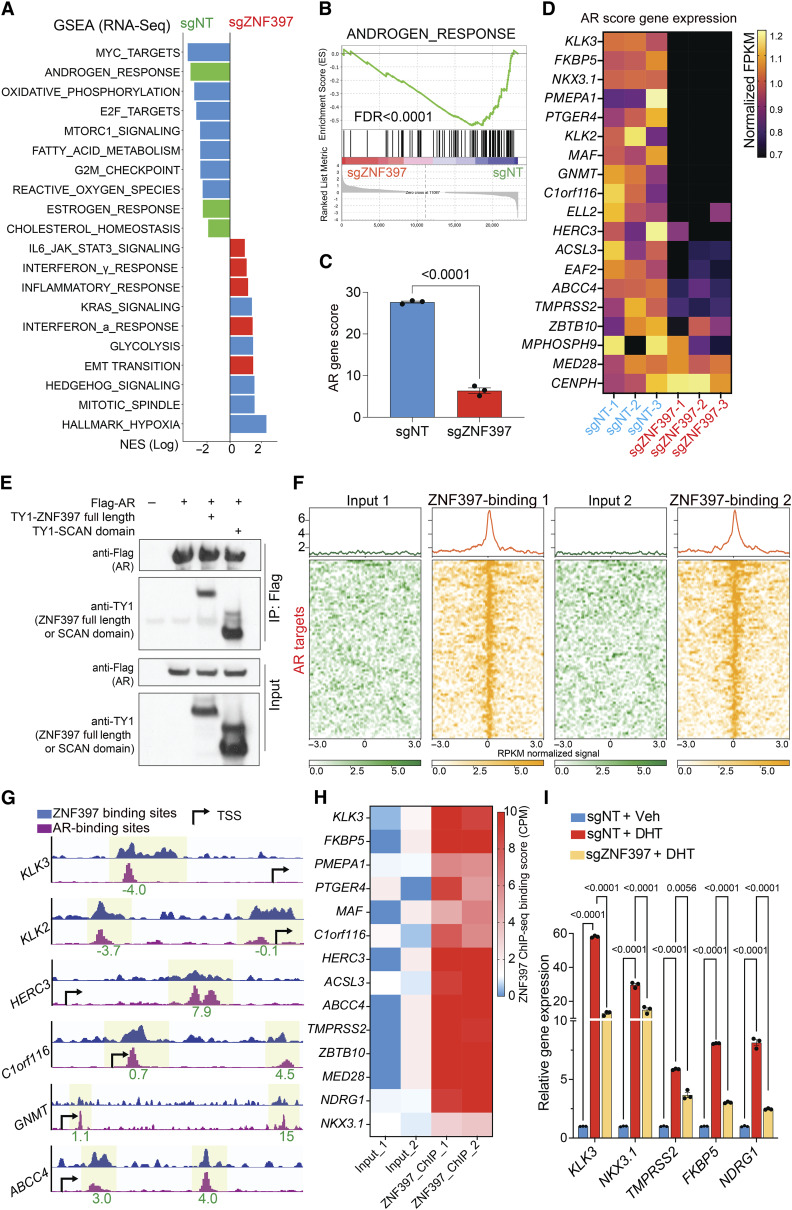
ZNF397 acts as a transcriptional coactivator essential for AR-driven signaling. A, GSEA Pathways analysis shows cancer-related signaling pathways significantly altered in ZNF397-KO cells compared to wild-type cells, lineage specific pathways were highlighted with color: green-AR dependent and luminal lineage pathways, red-lineage plastic signaling pathways. B, GSEA analysis of androgen response gene expression in ZNF397-KO cells compared to wild-type cells. C, AR gene score based on the expression of canonical AR target genes (AR Score Gene) in ZNF397-KO and wild-type cells. mean ± SEM are presented. P values were calculated using two-tailed t test. D, Heatmap represents the relative gene expression of AR Score genes in ZNF397-KO cells compared to wild-type cells, measured by RNA-seq. E, Co-IP of AR (with Flag tag) and full length or the SCAN domain of ZNF397 (with TY1 tag) in HEK293T cells. F, Global distribution of ZNF397 binding peaks at known AR binding sites (as determined by AR ChIP-seq), based on ZNF397 ChIP-seq in LNCaP/AR cells. Reads from two independently cultured cell samples were plotted and matching input controls were used for analysis. G, Representative AR-binding sites (as determined by AR ChIP-seq) and ZNF397-binding sites (as determined by ZNF397 ChIP-seq) in the genomic loci of canonical AR gene loci in the LNCaP/AR cell. The binding peak distances (kilo base pair) to TSS (transcriptional start site) are annotated in green. H, ZNF397-binding peak score (CPM, see “Methods”) in the genomic loci of AR Score genes (14 of 20) in LNCaP/AR cells. Reads from two independent cell cultures/guide were plotted, matching input controls were used for analysis. I, Relative gene expression levels of AR target genes in LNCaP/AR cells transduced with Cas9 and annotated guide RNAs, and treated with Veh (EtOH) or 10 nmol/L DHT for 12 hours, normalized and compared to sgNT + Veh group. For all panels unless otherwise noted, mean ± SEM are presented. P values were calculated using two-way ANOVA with Bonferroni multiple-comparison test. See also Supplementary Fig. S4 and Supplementary Table S2.

