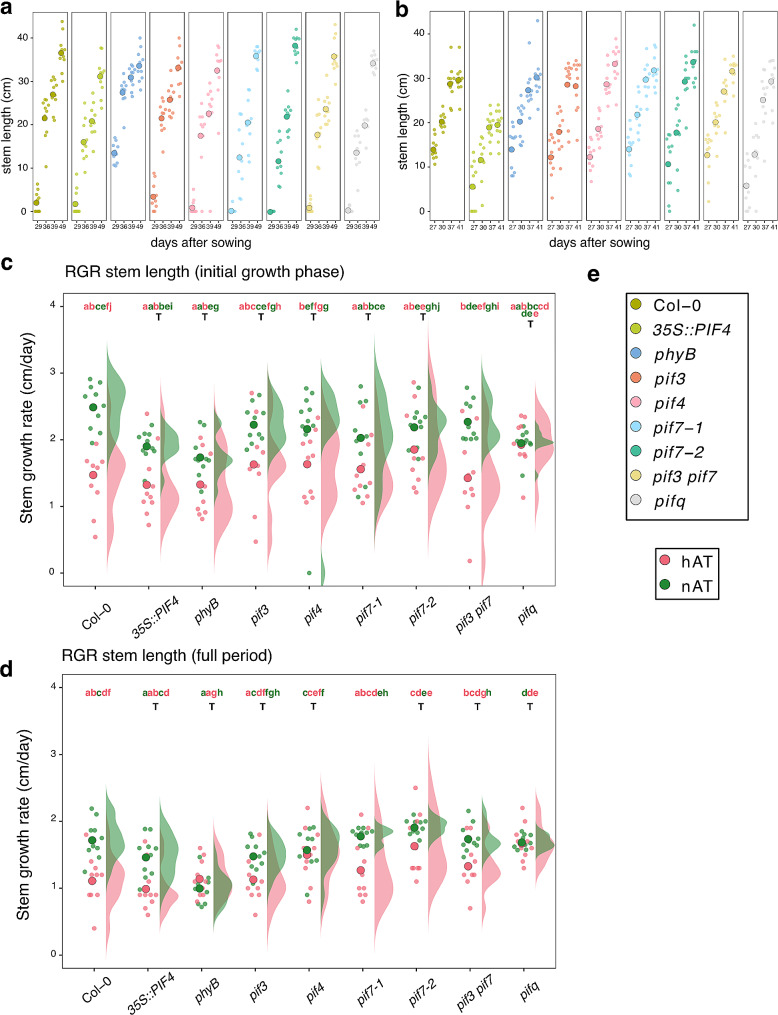
Fig. 3.
Temperature-induced early flowering and decreased inflorescence stem length. (a, b) Time series of the progression of primary inflorescence stem elongation (in cm) from 20 to 49 days after sowing for nAT (a) and up to 41 days after sowing for nAT (b). (a, b) n = 10 plants per genotype per condition. (c, d) Relative growth rate of the stem (in cm/day) during the full measurement period (29 days to 49 days after sowing at nAT, and 27 days to 41 days after sowing at hAT) (c) and from 29 to 39 days after sowing for nAT or from 27 and 27 days for hAT (d). (e) Color legend for a-d is provided. Data source is provided in Additional File 3 – Tables S3 and S5. Plants are presented in Additional File 1 – Fig. S4. The color of the letter matches the color of the temperature (green for nAT and red for hAT). The letter T indicates that there is no statistical effect of the temperature

