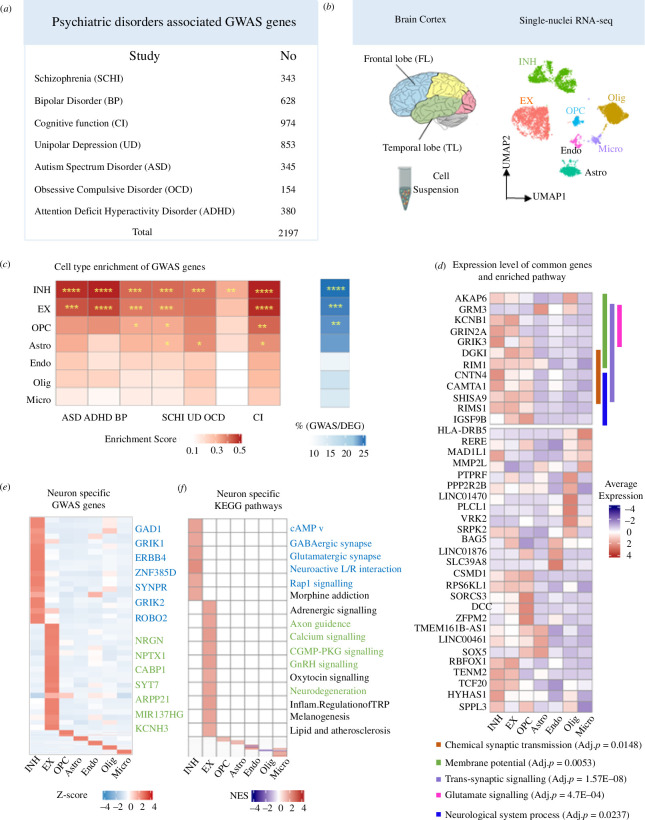
Figure 2.
GWAS-associated genes for neuropsychiatric disorders are enriched for neuronal expression. (a) Number of GWAS genes for neuropsychiatric disorders extracted from NHGRI-EBI GWAS catalogue. (b) Schematic diagram displaying the TL and FL brain neocortex (left). UMAP plot showing all main cell types identified in the snRNA-seq analysis: astrocyte (Astro) oligodendrocyte (Olig), microglia cells (Micro), endothelial cells (Endo), oligodendrocyte progenitor cells (OPC), EX and INH (right). More details are found in electronic supplementary material, figure S1. (c) Cell type enrichment score for expression of neuropsychiatric-associated GWAS genes grouped by disease (left). Proportion of GWAS genes within marker genes of each type with significance (BH-adjusted p-value) of the hypergeometric test labelled by asterisks (right): Significance (p-value) thresholds: *0.01−0.05, **0.001−0.01, ***0.0001−0.001, ****<0.0001. (d) Heatmap showing the specific marker genes that are also GWAS-associated genes in EX (green) and INH (blue), respectively. (e) Gene set enrichment analysis (GSEA) of cell type-specific differential expression in EX and INH (BH-adjusted p < 0.05). Pathways in green and in blue are contributed by GWAS genes in EX and INH, respectively. (f) Average (normalized) expression level of 38 genes (detected in seven neuropsychiatric diseases) in each cell type; the significant (non-redundant) Gene Ontology (GO) biological processes (BH-adjusted p < 0.05) for these 38 genes are also indicated by different colours (vertical bars) and annotated at the bottom.

