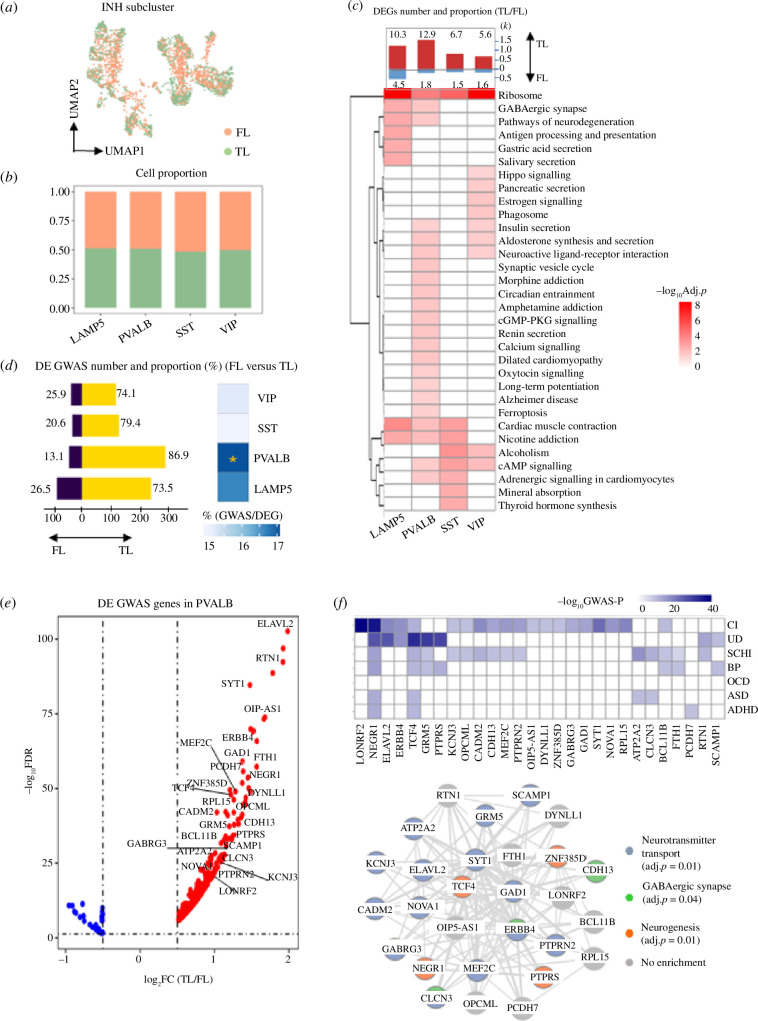
Figure 4.
GWAS-associated genes for neuropsychiatric disorders are specifically enriched for PVALB expression in the TL. (a) UMAP plot showing the FL and TL distribution to INH neurons. (b) Cell proportion of FL and TL in each subcluster. (c) Number of DEGs between FL and TL (absolute log2FC > 0.5 and FDR < 0.05) split by genes upregulated in FL and TL, respectively. The proportion (%) of DEGs over the total number of expressed genes is indicated for each subcluster (top). Heatmap exhibit the KEGG pathways enriched by DEGs between FL and TL (BH-adjusted p < 0.05). (d) Number of GWAS genes that are DE between FL and TL, split by upregulated in TL (yellow) and FL (purple), respectively. Numbers represent the proportion (%) of the upregulated DE GWAS genes in each region over the total number DE GWAS genes (left). Proportion (%) of all DE GWAS genes over the total of DEGs in each cell type; significant enrichment (by hypergeometric test) is indicated (right). *BH-adjusted p < 0.05. (e) Volcano plot showing log2FC (TL/FL) for the GWAS-associated genes in PVALB cluster. Subset of 28 GWAS genes with log2FC > 1 and GWAS p < 10−8 are highlighted in the graph. (f) Heatmap showing the GWAS p-values for the 28 genes in each disease (top). Gene network describing the interaction of the 28 GWAS genes. Edges represent gene–gene co-expression in PVALB neurons. Each node (gene) in the network is coloured according to the significant GO functional enrichment (BH-adjusted p < 0.05).

