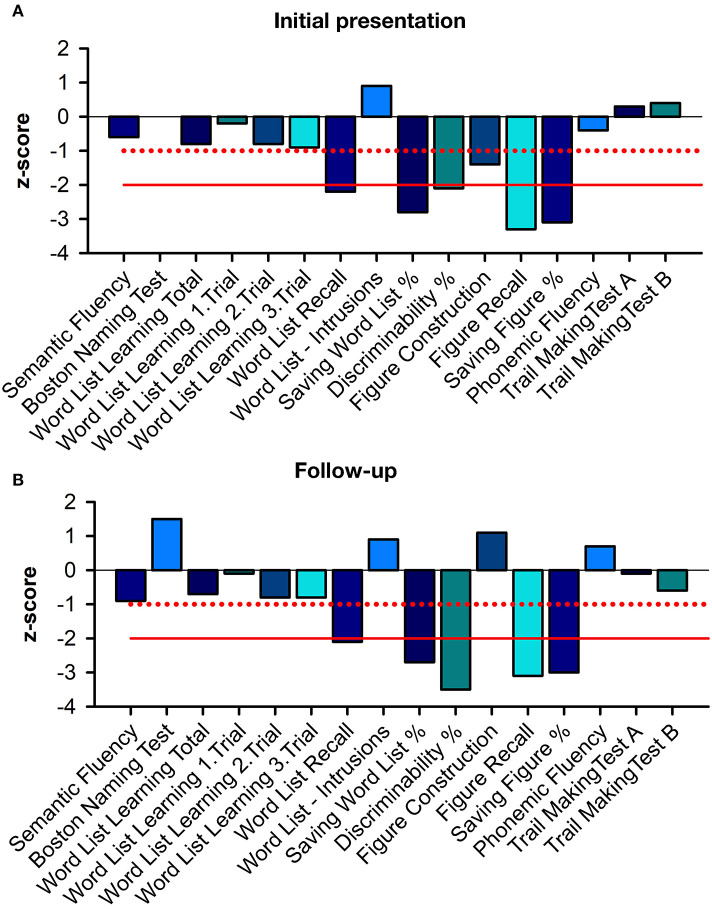
Figure 1.
Neuropsychological profile at initial presentation and follow-up. (A) shows the neuropsychological profile at the initial presentation, and (B) at the follow-up. A slight improvement in figure construction and the Boston naming test at follow-up can be seen. The red solid line indicates the twofold standard deviation, while the dashed red line means the single standard deviation.

