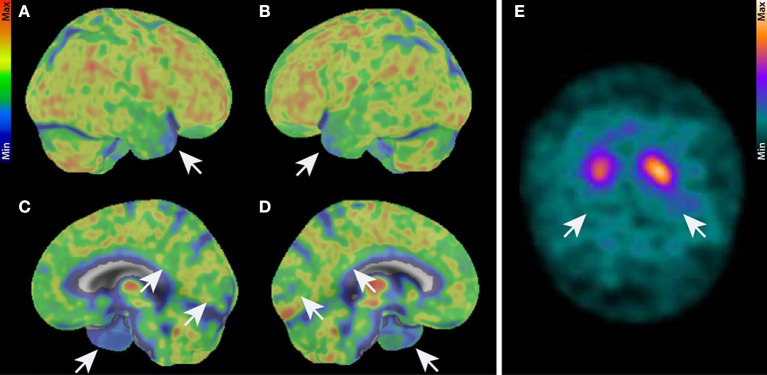
Figure 2.
Imaging. (A–D) 18F-FDG-PET. Brain hemisphere surface projections of 18F-FDG- uptake in right lateral (A), left lateral (B), right medial (C), and left medial (B) views show reduced tracer uptake in the temporal cortex, the posterior cingulate, precuneus, and slightly reduced uptake in the visual cortex (white arrows). (E) 123I-FP-CIT-SPECT in axial view showing abundant tracer uptake in the right putamen and lower uptake in the left putamen (white arrows). 123I-FP-CIT-SPECT, Single photon emission computed tomography with [(123)I]; N-omega-fluoropropyl-2betacarbomethoxy-3beta-{4-iodophenyl}nortropane; 18F-FDG-PET, 18F fluorodesoxyglucose positron emission tomography.

