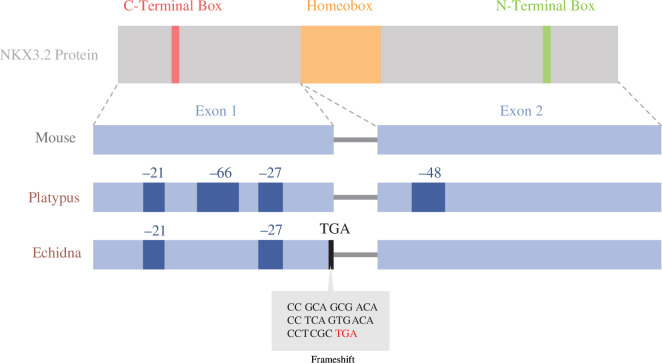
Figure 2.
Visualization of Nkx3.2 protein and exon architecture in the mouse, platypus and echidna overlayed with inactivating mutations and deletions found in monotreme taxa. Dark blue patches represent large deletions, black lines represent premature stop codons and the grey box represents a nucleotide alignment of the inactivating mutation in the echidna: a stop codon emerging from a frameshift mutation. Adapted from Osipova et al. [29].

