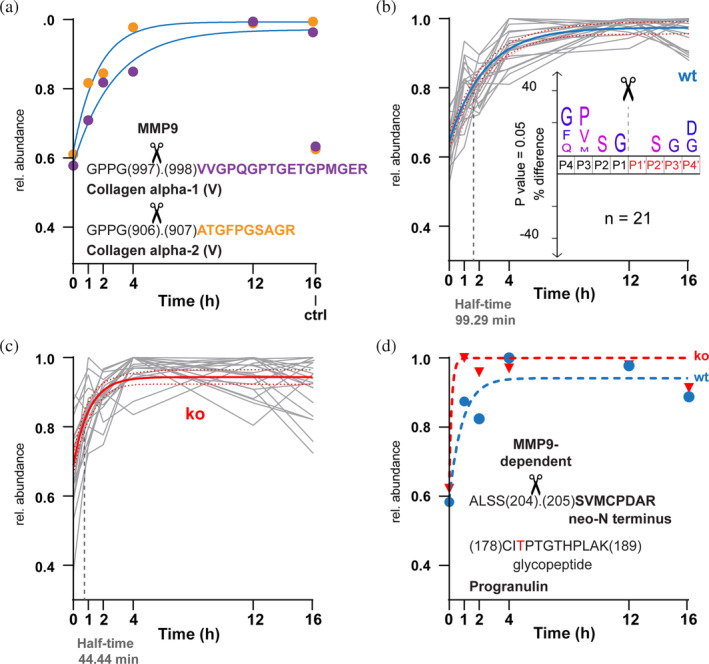
FIGURE 2.

MMP9‐time dependent processing in wt and ko cell secretomes. (a]) Known MMP9 cleavages have been extracted from the wt neo‐N termini dataset after normalization of abundance values to the maximum of wt time‐series. Values for respective neo‐N‐terminal peptides are color‐coded (purple: VVGPQGPTGETGPMGER, orange: ATGFPGSAGR), and curves have been fit following pseudo‐first‐order kinetics including all values but the 16 h control. (b,c) Abundance profiles in (a) have been used as templates to extract similar profiles (Euclidean distance; 10 closest feature/template feature) from the wt time (b) or ko (c) series. The shared curve has been fitted with best‐fit values for all datasets in the graph. Values for 16 h control are not shown. Half‐time indicates the half‐time parameter of the fitted curve. Inset in (b) shows IceLogo analysis of the 21 cleavage sites corresponding to neo‐N termini represented by the abundance profiles. (d) Data for MMP9‐dependent processing of progranulin has been extracted from graphs shown in (b) and (c) (blue: Wt, red: Ko) and individually fitted by pseudo‐first‐order kinetics. The shift indicates increased processing rate of mutant with truncated O‐glycan tree (ko) close to a known glycosite (in red).
