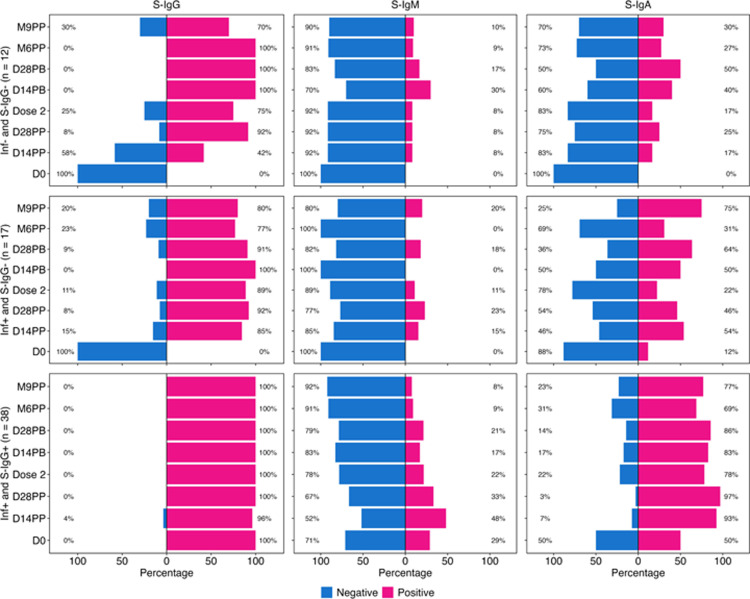
Fig 2. Seroconversion percentages at each time point.
Fig 2 presents the distribution of seroconversion percentages among three distinct subject subgroups: Inf- and S-IgG- (denoted as 2A, 2B, 2C), Inf+ and S-IgG- (denoted as 2D, 2E, 2F), and Inf+ and S-IgG+ (denoted as 2G, 2H, 2I). This distribution is further stratified based on the presence of S-IgG, S-IgM, and S-IgA antibodies, highlighting responders categorised by their positivity (pink) or negativity (blue) at each specimen time point.

