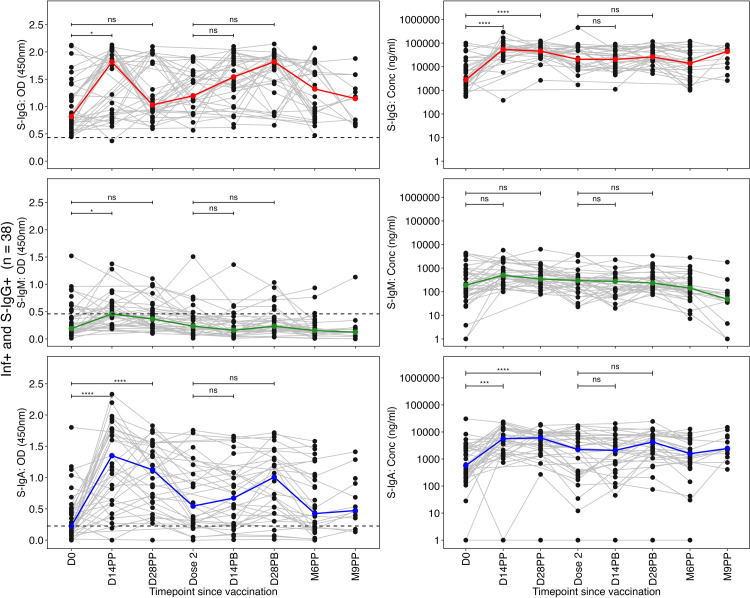
Fig 5. Dynamic trajectory of spike-directed antibody responses in previously infected baseline seropositive individuals (Inf+ and S-IgG+).
Fig 5 shows individual profile plots (grey lines) delineating participants initially infected and seropositive for Spike-directed IgG antibodies (Inf+ and S-IgG+) at baseline. These profiles (Fig 5A–5F) delineate the trajectory of their Spike-directed antibody responses across the study duration, encompassing Spike-directed S-IgG (Fig 5A and 5B), S-IgM (Fig 5C and 5D), and S-IgA (Fig 5E and 5F). The boldly coloured lines denote median antibody responses, while dashed horizontal lines denote reference OD cut-off values: S-IgG at 0.432, S-IgM at 0.459, and S-IgA at 0.226." We used the unpaired Wilcoxon test to assess differences in antibody responses post-vaccination. The significance levels were denoted as not significant (ns) for p > 0.05, * for p ≤ 0.05, ** for p < 0.01, *** for p < 0.001, and **** for p < 0.0001.

