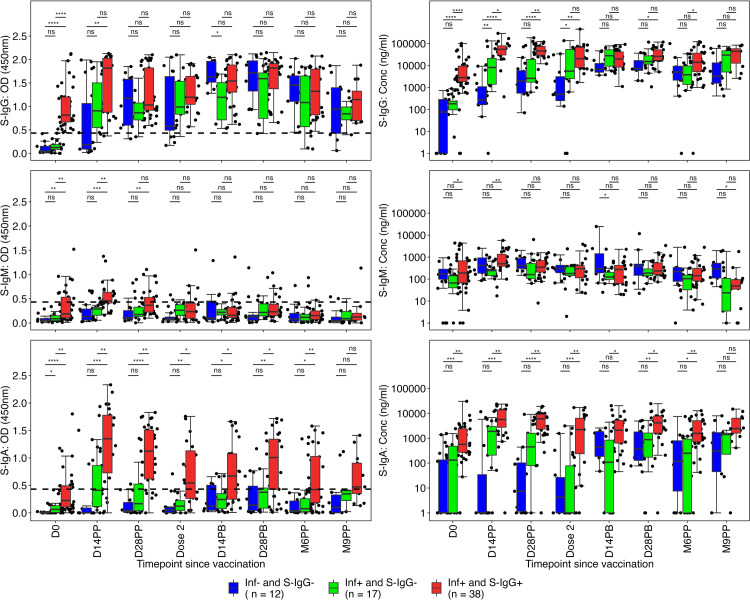
Fig 6. Box plots to compare spike-directed antibody responses across the three subgroups over time.
Fig 6 illustrates the box plots that compare the spike-directed S-IgG (Fig 6A and 6B), S-IgM (Fig 6C and 6D), and S-IgM (Fig 6E and 6F) antibody responses across the three subgroups over time. The statistical analysis employed an unpaired Wilcoxon test with Bonferroni correction for multiple testing, with p-values less than 0.05 indicating significance. Significance levels are denoted as follows: ns (non-significant) for p > 0.05, * for p ≤ 0.05, ** for p < 0.01, *** for p < 0.001, and **** for p < 0.0001.

