Figure 6.

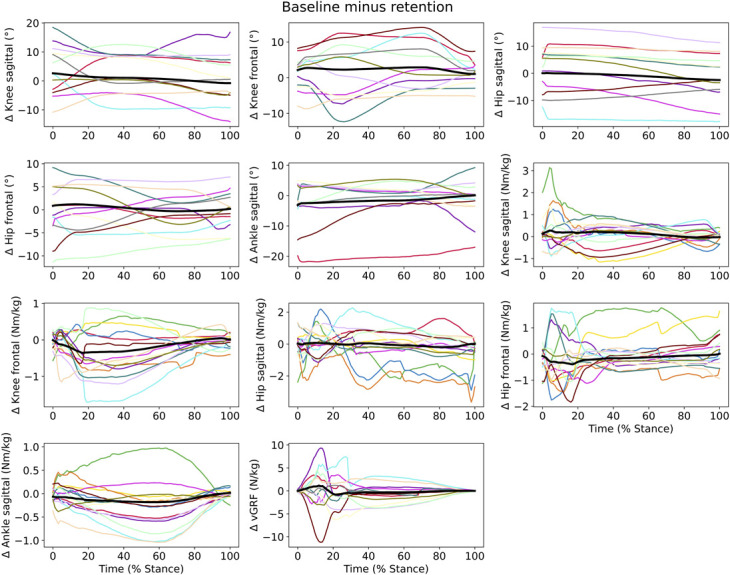
Individual baseline to retention changes of all variables. Greater values indicate a higher change from baseline to retention. Each color represents 1 subject. The black line indicates the mean change from baseline to retention.

Individual baseline to retention changes of all variables. Greater values indicate a higher change from baseline to retention. Each color represents 1 subject. The black line indicates the mean change from baseline to retention.