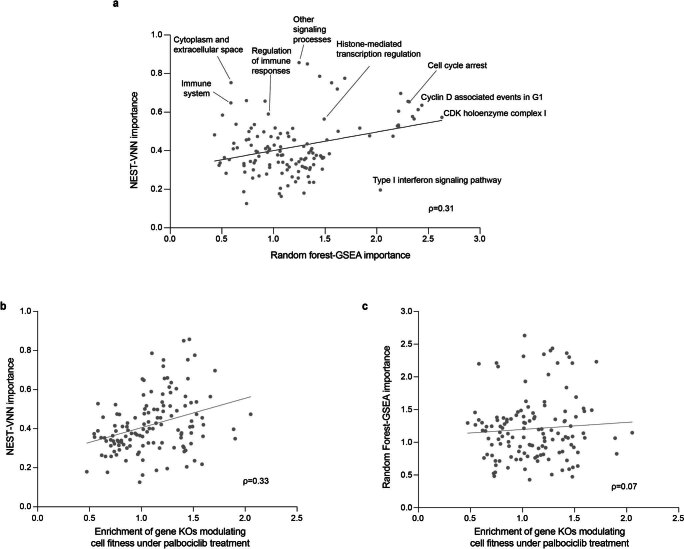
Extended Data Fig. 6. Supplemental comparison of NeST-VNN versus Random Forest models.
a, Scatter plot of assembly importances from a Random forest-GSEA approach (x-axis) versus a NeST-VNN approach (y-axis). b, Scatter plot of assembly importance in the NeST-VNN model (y-axis) versus enrichment of gene KOs modulating cell fitness under palbociclib treatment (x-axis). Each dot represents an assembly (n = 130). Rho (ρ) indicates the Pearson correlation. c, Same as panel b except the y-axis indicating Random Forest-GSEA importance.

